指標
移動平均線

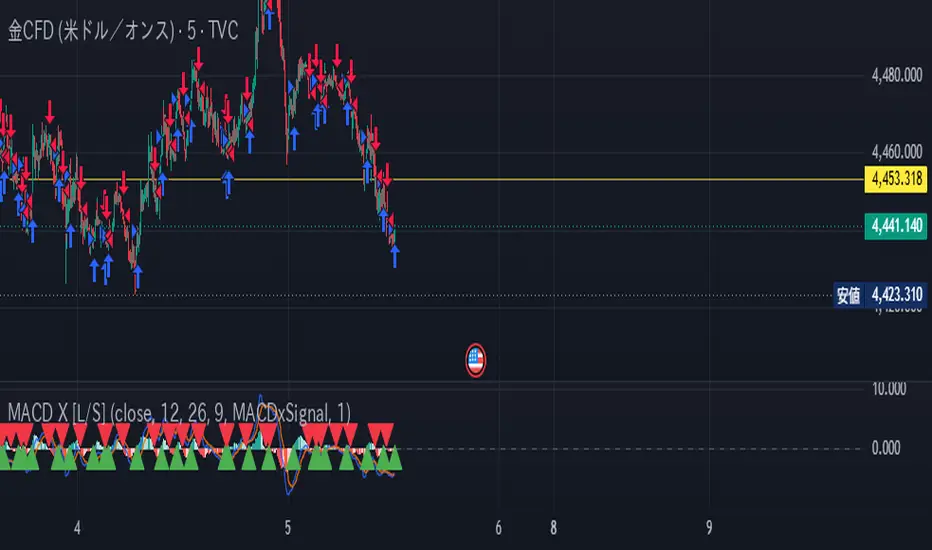
MACD Crossover Strategy [Long/Short]MACD Crossover Strategy
A clean, fully configurable MACD-based strategy built on Pine Script v6.
Supports two entry modes, independent Long/Short toggles, and four alert conditions — ready for both backtesting and live trading.
━━━━━━━━━━━━━━━━━━━━━━━
🔹 ENTRY CONDITIONS (selectable)
━━━━━━━━━━━━━━━━━━━━━━━
- MACDxSignal — Enter when the MACD line crosses the Signal line.
Fast, reactive. Suitable for trending markets.
- HistCross0 — Enter when the Histogram crosses zero.
Slightly smoothe
策略
Trend Heatmap"Trend Heatmap," is a custom technical indicator designed to measure and visualize the strength and direction of market trends by combining price action with volume data.
Instead of relying on a single moving average or momentum oscillator, it creates a custom "heatmap" value that attempts to quantify whether buying or selling pressure is currently dominant.
The script does not plot directly on your main price chart; it appears in a separate pane below the chart.
This indicator is designed to
指標

Mr Balwants ADR (Previous 14 Days)# ADR (Previous 14 Days)
This indicator calculates the Average Daily Range (ADR) using the previous 14 completed trading days.
The ADR is determined by taking the daily range (High - Low) of each completed day and calculating the average over the selected lookback period. The current day's incomplete range is excluded to ensure that the value is based only on confirmed market data.
Features:
• Uses completed daily candles only.
• Calculates ADR from the previous 14 trading days.
• Displays th
指標

EMA 3 y 9 RESTEST 50 Cross ADX PRO EMA Cross + ADX PRO is a trend-following indicator that combines EMA crossovers, ADX momentum filtering, and a dynamic weighted scoring system to generate high-quality entry and cancellation signals.
How it works:
The indicator triggers a signal when all of the following conditions align simultaneously:
EMA 3 crosses EMA 9 (crossover for BUY, crossunder for SELL)
Price is in the EMA 50 retest zone (±0.25% band)
Trend filter: close above (BUY) or below (SELL) EMA 50
RSI > 50 for longs / RSI < 50
指標

SPY ATR BandsAn all-in-one overlay that combines ATR-based deviation bands, all-time-high levels, and a weekly-EMA trend filter into a single clean tool. Built for swing dip-buying on SPY, but works on any symbol.
Features
• Multi-timeframe ATR bands (D / 4H / 1H) — Keltner-family bands built from an RMA centerline ± ATR × multiplier, with three depths each (narrow ×0.6 / main / wide ×1.5). Because they scale with ATR, a touch of the wide band means a statistically significant move relative to current vola
指標

Hour-End SMACalculates a Simple Moving Average using TRUE RTH hour-end prices.
Uses 30-minute bars to derive hour-end "LAST" prices
指標

EMA Switcher M5 H4Crossover triangles only appear in M5 mode, since they're most useful for the fast scalping pair. In H4 mode you get the full fib stack for support/resistance mapping.
指標

EMA 21/55/89/144Fibonacci-based EMA set for H4 support/resistance. The thicker lines (89 and 144) are your stronger, more respected levels — so they stand out visually on the chart.
When all four EMAs fan out and align in order, that signals a strong trend. When they cluster tightly together, the market is consolidating — often before a breakout.
指標

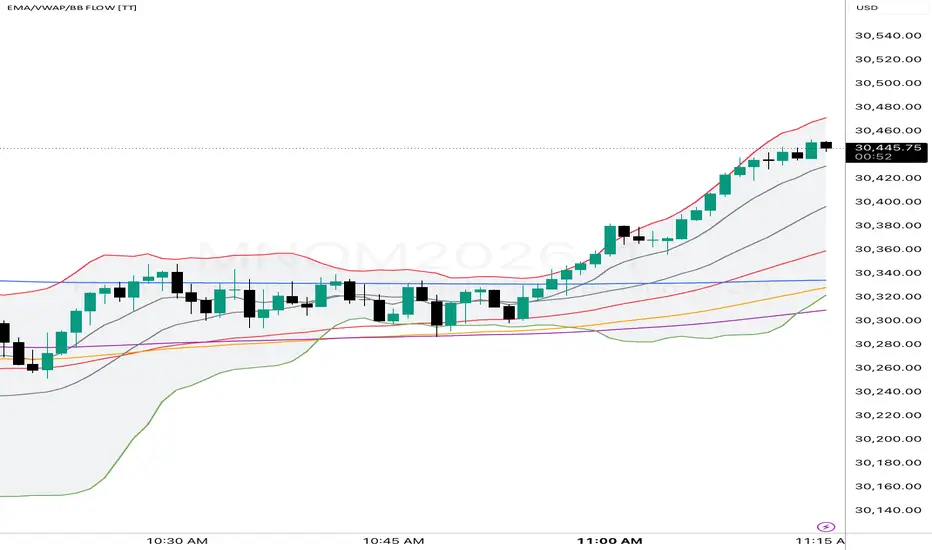
EMA/VWAP/BB FLOW [TT]# EMA/VWAP/BB FLOW
EMA/VWAP/BB FLOW is a streamlined trend and structure tool designed for traders who rely on moving averages, VWAP, and Bollinger Bands without unnecessary clutter.
This indicator combines multiple key EMAs, session VWAP, and customizable Bollinger Bands into a single lightweight package, allowing traders to build their preferred workflow while keeping charts clean and organized.
### Features
• 11 Exponential Moving Averages:
* EMA 5
* EMA 9
* EMA 14
* EMA 21
* EMA 30
指標
Hitesh Nimje 2026To publish your indicator on TradingView, you need a clear, professional description that explains the features to potential users. Since your script is a powerful "All-in-One" suite, here is a template you can use.
Title Idea
Hitesh Nimje | Combined Trading Suite (EMA Bundle + Sessions + MTF Levels)
Description Template
Description:
This all-in-one trading tool combines essential trend-following indicators and market structure analysis to provide a clean, clutter-free workspace. Designed for
指標

Session Volume Moving Average [LuxAlgo]The Session Volume Moving Average indicator is a comprehensive volume analysis tool that plots volume bars directly on a moving average, providing a unique perspective on volume activity in relation to price trends.
It features session-specific volume profiling, streak detection, and a dynamic volume delta system to visualize market participation and institutional activity.
🔶 USAGE
The script serves as a multi-dimensional volume dashboard, allowing users to see not just the amount of vol
指標

EMA Horizon█ OVERVIEW
The EMA Horizon indicator offers a modern, structural upgrade to the classic Exponential Moving Average. While standard EMAs are indispensable tools for trend identification, they inherently suffer from "live candle blindness" —flickering wildly on the current unclosed bar and causing traders to miss critical intraday touches or fall into false breakout traps.
EMA Horizon solves this by calculating an immediate forward-looking volatility corridor based on the asset's actual phy
指標

3EMA by Next LevelThis indicator plots the 3 Exponential Moving Averages - 50, 100, and 200 EMA directly on your price chart.
This will help you quickly identify trend direction, dynamic support and resistance levels, and potential entry or exit zones.
Color coding:
🟢 EMA 50 — Short-term trend
🟠 EMA 100 — Medium-term trend
🔴 EMA 200 — Long-term trend
How to use it:
Price above all 3 EMAs = bullish structure
Price below all 3 EMAs = bearish structure
Watch for EMA crossovers as early trend shift signals
The 2
指標

3EMA by Next LevelThis indicator plots the 3 Exponential Moving Averages - 50, 100, and 200 EMA directly on your price chart.
This will help you quickly identify trend direction, dynamic support and resistance levels, and potential entry or exit zones.
Color coding:
🟢 EMA 50 — Short-term trend
🟠 EMA 100 — Medium-term trend
🔴 EMA 200 — Long-term trend
How to use it:
Price above all 3 EMAs = bullish structure
Price below all 3 EMAs = bearish structure
Watch for EMA crossovers as early trend shift signals
The 2
指標

ID004 VIX Fear Timing IndicatorA volatility-aware staged dip-recovery indicator designed to help traders study pullback recovery conditions using price action, staged DCA logic, higher-timeframe context, and VIX fear timing.
---------------------------------------------------------------------------------------------------
## 1. What this indicator is for 🧭
---------------------------------------------------------------------------------------------------
This indicator is designed to help traders study possible recove
指標

EMA Alignment Buy SignalEMA Alignment Buy Signal
This indicator identifies bullish trend alignment using four exponential moving averages: 9 EMA, 20 EMA, 50 EMA, and 200 EMA.
A BUY signal is generated when the full candle is positioned above the 9 EMA and the moving averages are aligned in bullish order:
Low > 9 EMA > 20 EMA > 50 EMA > 200 EMA
This means the candle’s low must be above the 9 EMA, confirming that the entire candle is trading above the fastest EMA. The signal only appears when the condition first bec
指標

RSI Candlestick Trend SuiteRSI Candlestick Trend Suite
This indicator presents the Relative Strength Index (RSI) as candlesticks instead of a traditional line, providing a different perspective on momentum behavior and trend development.
The script combines several RSI-based analytical tools into a single oscillator panel:
• RSI Candlestick Visualization
* Displays RSI values as candle structures.
* Highlights momentum expansion and contraction.
* Improves visibility of short-term RSI direction changes.
• Moving Aver
指標

Kalman Flow TrailKalman Flow Trail
Kalman Flow Trail is a clean trend-following and market structure overlay designed to help traders read market direction, structural shifts, protected levels, liquidity targets, and higher-timeframe alignment from one chart.
The script combines an adaptive Kalman-based trail with market structure logic, live strong/weak range levels, POI supply and demand zones, optional MSS/MSB guides, higher-timeframe confirmation, flip markers, and a compact Flow Dashboard.
Core Features
指標

HA_with_FriendsHA_with_Friends =
HA + Momentum + EMA + WWV Combined Indicator
This indicator combines four powerful technical analysis tools into a single pane, designed primarily for XAUUSD (Gold) trading but applicable to any instrument.
─── COMPONENTS ───────────────────────────────────────
1. Heiken Ashi Candles
Displays smoothed Heiken Ashi candlesticks to filter out market noise
and identify trend direction more clearly than standard candles.
2. EMA Cloud (50/100)
Two Exponential Moving Aver
指標

BB + 9EMA + Hammer + FVG w/ Gann BoxThis indicator merges four powerful tools into one: Bollinger Bands (34-period), a 9 EMA with optional smoothing, Hammer & Shooting Star pattern detection, and Fair Value Gaps with Gann Box levels built in. No more switching between indicators — everything you need on one chart.
指標

Volume Split - Buy vs SellThis indicator allows visibility of absorption through viewing as buy and sell side volume. If each side is matched within a given percentage (you can select via a parameter), then the given volume bar will be highlighted. Additionally there is an alert on the SMA if the price action crosses the SMA, this is simply something I have been working on in combination.
Constructive thoughts and ideas are welcome.
PSA - AI was utilized in the making of this indicator.
指標

Core SMA SetDescription:
This indicator automatically plots the most important moving averages onto your chart in a single package. It locks in the exact daily and weekly lines, meaning you can see the larger market trends even when you are zoomed in on a shorter timeframe like a 5-minute or 1-hour chart.
What's Included:
10-Day Average: Blue line
20-Day Average: Yellow line
50-Day Average: Green line
120-Day Average: White dotted line
200-Day Average: Red line
200-Week Average: Thick white line
Thi
指標

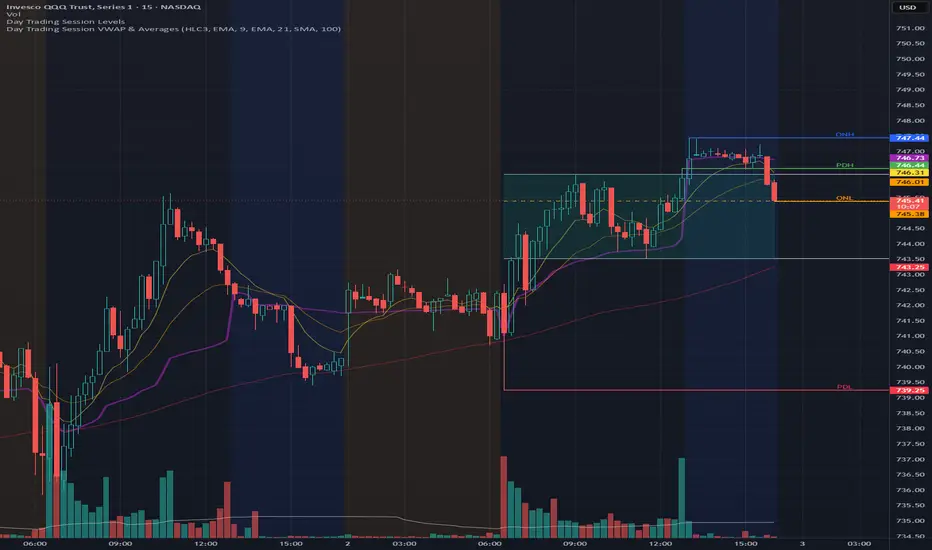
Day Trading Session VWAP & AveragesA clean, session‑aware VWAP and Moving Averages indicator designed for intraday traders who want accurate, stable, session‑anchored levels without chart clutter.
This tool tracks RTH VWAP, Overnight VWAP, and VWAP Standard Deviation Bands, resetting cleanly at each session boundary for precise institutional‑style reference levels.
📌 Key Features
Session‑Anchored VWAP
VWAP resets at RTH open
VWAP resets again at RTH close
ON session (PM → AH → Globex PM → Globex AM) uses one continuous V
指標