Pivot Points by ParaticaPivot Points are very important for specially day traders. But Tradingview provides only monthly Pivot Points. You can check Pivot Points in any Chart Interval with this indicator.指標由theprtc提供已更新 384
Pivot Daily Price ColorJust daily pivot with area color: - price above daily pivot : green area - price below daily pivot : red area指標由rimko提供已更新 1175
Pivot Point Daily prediction bitcoin - by Simon-RoseThis is an additional Script to my recent Pivot Point indicator scripts which will show you the next days pivot points based on the actual price range. This is useful if you are trading right before a new day and want to know how the next bdays pivot points may be placed. If you have any questions or suggestions pls write me :) Happy trading Cheers Daily Pivots: Weekly Version: Monthly Version: 指標由Simon-Rose提供已更新 570
Combined MTF Camarilla Pivots (HA + Candles)This is a fairly basic (but hopefully useful) indicator that combines three time-frames of Camarilla pivots into one. Default time-frames are: Weekly Monthly Yearly Time-frames can be modified as you wish, they are just set to these as I generally only trade higher intervals (just note that formatting labels will not change - but you can update these as needed). The Camarilla pivots displayed are as follows: R3, R4, R5, R6 Pivot line (Middle/Base) S3, S4, S5, S6 R1/S1 & R指標由DreamsDefined提供19497
Pivot Point Monthly - bitcoin by Simon-RoseMonthly Version: I have written 3 Indicators because i couldn't find what i was looking for in the library, so you can turn each one on and off individually for better visibility. This are Daily, Weekly and Monthly Pivot Points with their Resistance and Support Points and also on the Daily with the range between them. I will also publish some Ideas to show you how to use them if you are not familiar with the traditional pivot points strategy already. Unlike the usually 3 support & resist指標由Simon-Rose提供已更新 74
Pivot Points Weekly - bitcoin by Simon-RoseWeekly Version: I have written 3 Indicators because i couldn't find what i was looking for in the library, so you can turn each one on and off individually for better visibility. This are Daily, Weekly and Monthly Pivot Points with their Resistance and Support Points and also on the Daily with the range between them. I will also publish some Ideas to show you how to use them if you are not familiar with the traditional pivot points strategy already. Unlike the usually 3 support & resista指標由Simon-Rose提供已更新 295
Pivot Points Daily - bitcoin by Simon-RoseDaily Version: I have written 3 Indicators because i couldn't find what i was looking for in the library, so you can turn each one on and off individually for better visibility. This are Daily, Weekly and Monthly Pivot Points with their Resistance and Support Points and also on the Daily with the range between them. I will also publish some Ideas to show you how to use them if you are not familiar with the traditional pivot points strategy already. Unlike the usually 3 support & resistan指標由Simon-Rose提供已更新 72
Fibs-PivotsThis Pivots are based on 2 days of Fibs upper and lower . In contrast to regular pivots that based on price , this one based on the high and low of the extreme ends of the fibs system. you can change the fibs to be daily or longer to find proper setting . Also you can change the lookback to be longer or shorter to see points of interest . It easy to add alerts to this system if one want to do it 指標由RafaelZioni提供已更新 2209
Weekly/Daily Cross & Bias ConfirmationThis indicator plots the weekly and daily open in addition to a current close price line. It also signals when price closes above or below the daily and weekly opens. Also, the bull/bear bias is painted on this indicator as well. Black is the weekly open Silver is the daily open Weekly is default black arrows. Up is going above open, down is going below Daily is default aqua arrows. Up is going above, down is going below 指標由RexDogActual提供已更新 1376
sma-pivotsThis model is based on this script I change it to sma model . the model run on pivots high or low that are base on SMA I make two SMA one for high pivots and one for low pivots ( I put for now at same distance but you need to change it according to needs) because asset can be in bull period or bear period when we have two separate distance of SMA we can find the correct combination if to buy more or less by changing either the sma pivot of the low end or the sma pivots of the high end using t指標由RafaelZioni提供96
HTF High/LowThis simple script draws the previous higher timeframe candle high/low to your chart. You can also make the script paint the zone between the low/open and the high/close.指標由ZenAndTheArtOfTrading提供已更新 6 1.2 K
Dynamic Price ChannelsThis indicator plots dynamic price channels based on the security highest close and lowest open. The default is to display 8 core channels (with the option to plot the sub channel lines, off by default). It’s simple really—this just divides the price action into equal channels. I’ve found this pattern helpful across all markets. It’s dynamic because if a new high close or a new low close is created the all channels will adjust. The key levels are 75% (blue), 50% (aqua), 25% (blue). In b指標由RexDogActual提供已更新 4358
Monthly OHLCThis indicator displays the monthly Open, High, Low and Close price on a chart. Very helpful indicator for starting your trading week (I use it every week in FOREX, Crypto, and Equities). In conjunction using this on the Weekly & Daily timerfame with a 200, 10 and 5 EMA you can start your week off with a probable bull or bear bias.指標由RexDogActual提供3296
Key Distances (Weekly, Daily Open, & EMA)This indicator provides the pip value from various key levels I've found important in my trading system. The results are graphed. I suggest that you choose the 2 most important ones you want to graph otherwise the indicator gets difficult to read. The important data is the actual numbers but I've found it helpful to understand how a ticker moves in regards to weekly open and distance from 200EMA to be most helpful. Here is the order of the data listed: Distance from weekly open (green if a指標由RexDogActual提供已更新 86
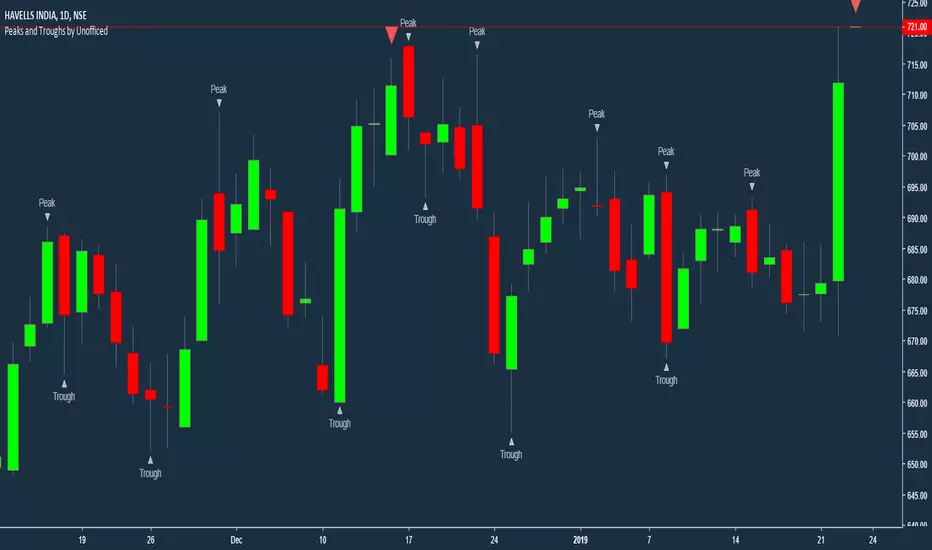
Swing PointsThis indicator gives a clear indication of price action swing-points as well as an indication of whether it is a higher, lower, or equal swing point relative to the last high/low.指標由ajmd_trades提供12 2.5 K
Kawabunga Swing Failure Points Candles (SFP) by RRBKawabunga Swing Failure Points Candles (SFP) by RagingRocketBull 2019 Version 1.0 This indicator shows Swing Failure Points (SFP) and Swing Confirmation Points (SCP) as candles on a chart. SFP/SCP candles are used by traders as signals for trend confirmation/possible reversal. The signal is stronger on a higher volume/larger candle size. A Swing Failure Point (SFP) candle is used to spot a reversal: - up trend SFP is a failure to close above prev high after making a new higher high => implie指標由RagingRocketBull提供已更新 22912
PIVOT DONThis indicator is great to detect resistance and support The H and L are based on new high and low formed by Donchian cahnnel , the lines of support and resistance are based on pivot system by the TF you can control the time length of the donchian channel no alert to this system 指標由RafaelZioni提供已更新 1197
SwingsSwing High and Swing Low as discussed in Bounce Theory A Swing Low is the low of the candle that has a higher low on either side. A Swing High is the high of the candle that has a lower high on either side. In the case of Swing High, the high of the neighbour candles are lower than the high of the main candle itself. In the case of Swing Low, the low of the neighbour candles are higher than the low of the main candle itself. 指標由Amit_Ghosh提供1584
Perfect SwingsPerfect Swing Highs and Perfect Swing Lows as per the theory of Bounce. Refer - 指標由Amit_Ghosh提供3389
Standard Deviation W/Q/M PivotsThis is a re-iteration of the standard deviation of daily pivots with the pivots applied on weekly, monthly, quarterly and yearly levels. For intraday traders the weekly pivot points will act as a major support resistance levels. Quarterly and monthly pivot points are useful for short-term positions while the yearly pivot determines the stock's long term support-resistance levels and useful in determining if the stock is in a bullish/bearish leg.指標由dbdecoy提供5164
VJ - Killer BSTry the Buy and sell with different time frames. Tune your entry and exit as needed指標由vinukj提供22705