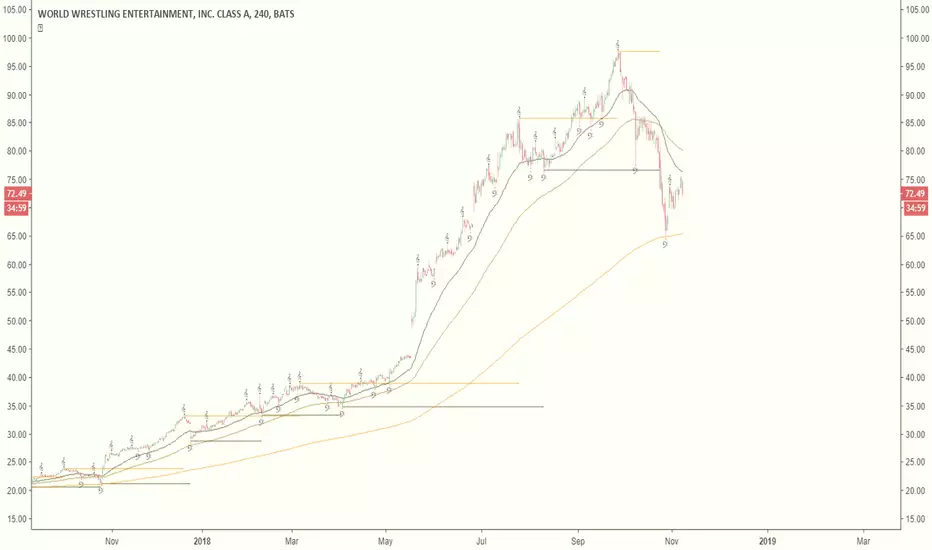
Chad Swing High/Low (Prophet)Marks swing highs and lows (e.g: a high with a lower high on either side), to simplify counting CBLs.指標由Pr0phet_提供95
Floor Pivot Points Backtest The name ‘Floor-Trader Pivot,’ came from the fact that Pivot points can be calculated quickly, on the fly using price data from the previous day as an input. Although time-frames of less than a day can be used, Pivots are commonly plotted on the Daily Chart; using price data from the previous day’s trading activity. You can change long to short in the Input Settings WARNING: - For purpose educate only - This script to change bars colors.策略由HPotter提供22123
Floor Pivot Points Strategy The name ‘Floor-Trader Pivot,’ came from the fact that Pivot points can be calculated quickly, on the fly using price data from the previous day as an input. Although time-frames of less than a day can be used, Pivots are commonly plotted on the Daily Chart; using price data from the previous day’s trading activity. WARNING: - This script to change bars colors.指標由HPotter提供2266
Ease of Movement (EOM) Backtest This indicator gauges the magnitude of price and volume movement. The indicator returns both positive and negative values where a positive value means the market has moved up from yesterday's value and a negative value means the market has moved down. A large positive or large negative value indicates a large move in price and/or lighter volume. A small positive or small negative value indicates a small move in price and/or heavier volume. A positive or negative numeric value. A positive value means the market has moved up from yesterday's value, whereas, a negative value means the market has moved down. You can change long to short in the Input Settings WARNING: - For purpose educate only - This script to change bars colors.策略由HPotter提供57
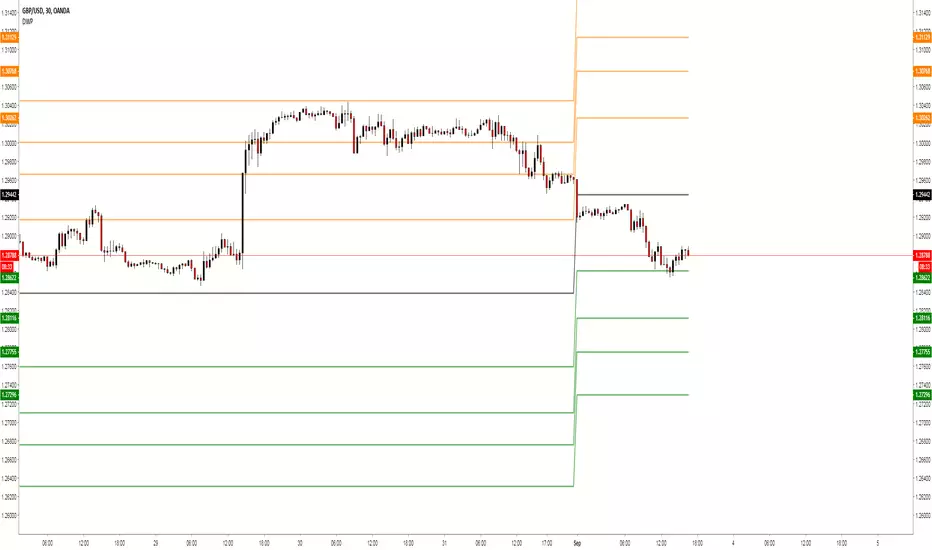
Dynamic Pivot Point Backtest This Pivot points is calculated on the current day. Pivot points simply took the high, low, and closing price from the previous period and divided by 3 to find the pivot. From this pivot, traders would then base their calculations for three support, and three resistance levels. The calculation for the most basic flavor of pivot points, known as ‘floor-trader pivots’, along with their support and resistance levels. You can change long to short in the Input Settings WARNING: - For purpose educate only - This script to change bars colors.策略由HPotter提供44198
Dynamic Pivot Point Strategy This Pivot points is calculated on the current day. Pivot points simply took the high, low, and closing price from the previous period and divided by 3 to find the pivot. From this pivot, traders would then base their calculations for three support, and three resistance levels. The calculation for the most basic flavor of pivot points, known as ‘floor-trader pivots’, along with their support and resistance levels. WARNING: - This script to change bars colors.指標由HPotter提供已更新 1010106
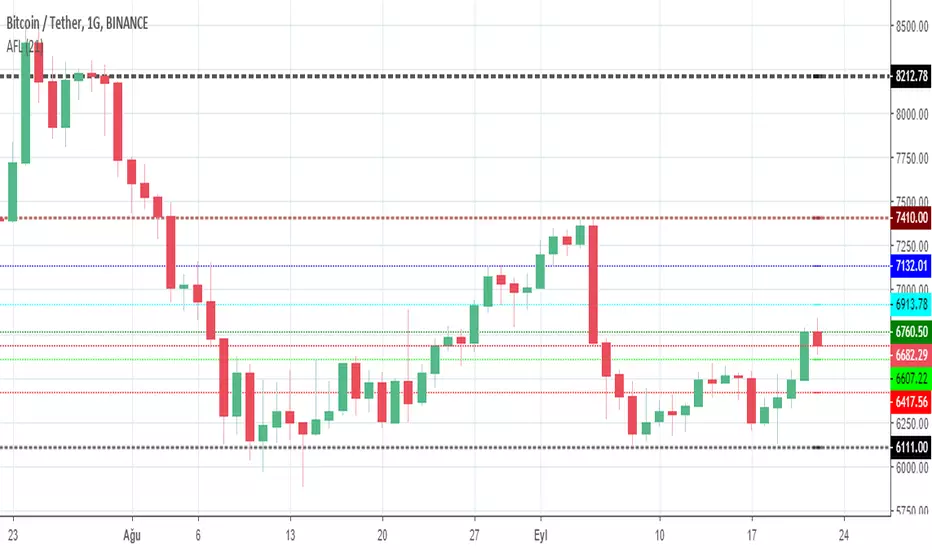
Pivot Reversal Strategy with Alerts - Ru++changing from blue to white for better visibility on dark theme指標由bitcorn_bob提供99295
YTC - Swing Highs & LowsThis Indicator Plots Swing Highs & Swing Lows based on Lance Beggs of (Your Trading Coach) definition: A Swing High (SH) is a price bar high preceed by two lower highs (LH) and followed by two lower highs (LH) In the event of multiple candles forming equal highs, this will still be defined as a swing high, provided that there are two candles with lower highs both preceding and following the multiple candle formation.指標由jatubio提供已更新 55187
Pivot Points High Low ExtensionPivot Points High Low Extension See Also: - A Simple 1-2-3 Method for Trading Forex - The Classic 1-2-3 Pattern: An Underestimated Powerhouse - Bulkowski's 1-2-3 Trend Change 指標由sherwind提供44 2.1 K
Fibonacci Pivots Enhanced Levels (daily)Fibonacci pivot point levels multiply the previous day’s range with its corresponding Fibonacci level. Tradingview Standard Pivot Template includes S/R Levels 1 – 3 only . I take into account additional Fibonacci pivot levels (S/R 4 – 7) on daily basis (no need for higher timeframes - weekly, monthly).指標由JaDeVin提供99779
real body rangeHighlights point of largest positive and negative candle ranges based on the look back length. Works for all time frames May have some value added for points of support and resistance relative to the buyer and sellers associated with that specific candle. For the sake of keeping the chart clean I elected to eliminate the first data point and used the "linebr" style and fill plots. I also used //@version=2 which works better for the fill plots. //@version=3 seemed to jam me up so if you edit and run with it you may need to retain the version=2 configuration. If you find an alternative method that works for version=3 please give me a shout. Apply at your own risk and discretion. Squam指標由Squam_Gobaloochee提供156
Standard Deviation Pivot pointsSupport Resistance points that are calculated based on the standard deviation of the traditional pivot point(previous session's high, low and close). More often stocks tend to oscillate between 3 levels of deviation forming day's high or low. A breakout of the 3rd SR level with volume indicates a strong trend day.指標由dbdecoy提供已更新 1313837
Bitcoin Kill Zones v2 |7Day| [oscarvs] [xeno]This edit adds weekends to Bitcoin Kill Zones v2 by oscarvs and other contributors. Bit of an experiment. Enjoy.指標由Threshold提供已更新 206