Alert for 3Commas Bollinger StrategyThis is just an alert for the 3Commas Bollinger Strategy written by tedwardd指標由TheAstronomer提供已更新 1429
CAPE (Shiller PE) RatioCalculating the Shiller PE Ratio (aka cyclically adjusted price to earnings ratio). The calculation is similar to the traditional PE ratio, however uses the simple average of the earnings over past 5 years (default is 5, can choose different) adjusted for inflation (default is the Australian CPI index however a different index can be used in the input). 指標由Bhavek_Jam提供66
Stan Weinstein 30-week Moving AverageStan Weinstein's book 'Secrets for Profiting in Bull and Bear Markets' is without doubt one of the classics books traders read. Weinstein said that at any one point in time, a stock (or an index) will be in one of four market "stages": Stage 1 the Basing Area (also known as consolidation or accumulation phase) Stage 2 the Advancing Stage Stage 3 the Top Area (also known as the distribution phase), or Stage 4 the Declining Stage One of the concepts from the book that became classic is the defin指標由marcellagerwerf提供6864
Daily and Weekly Moving Averages on Daily ChartFor the long term trend I use the 200 and 150 daily moving averages. The 200-day MA will be plotted as a black line. It is a no-go zone to buy anything trading below that. The 150-day, or 30-week like Stan Weinstein uses, is plotted in orange. Than I use the 50 day moving average but also the 10 week moving average. While those look similar there is a small difference which sometimes impacts the choice for selling a stock or holding on to it. That slight difference is useful in different situ指標由marcellagerwerf提供3324
ChBrkOutStrategySMAThis script relies on channel breakout strategy and the exit condition is defined by the SMA crossover, this works well on futures and Indices策略由anshuanshu333提供58
Extrema DetectorDetermines local maximums and minimums points in the chart. Parameters: lookback : number of candlesticks to look. extrema_finder_sensivity : If lower, more extreme points will be found (may over-find). Brief algorithm description: Computes a Simple Moving Average (length= extrema_finder_sensivity ), and searches for its local extremes. Given some SMA extreme, it looks the previous extrema_finder_sensivity candlesticks to find the highest (or lowest value). Notes: Is a lagged indicat指標由cryptocashcashoo提供已更新 7267
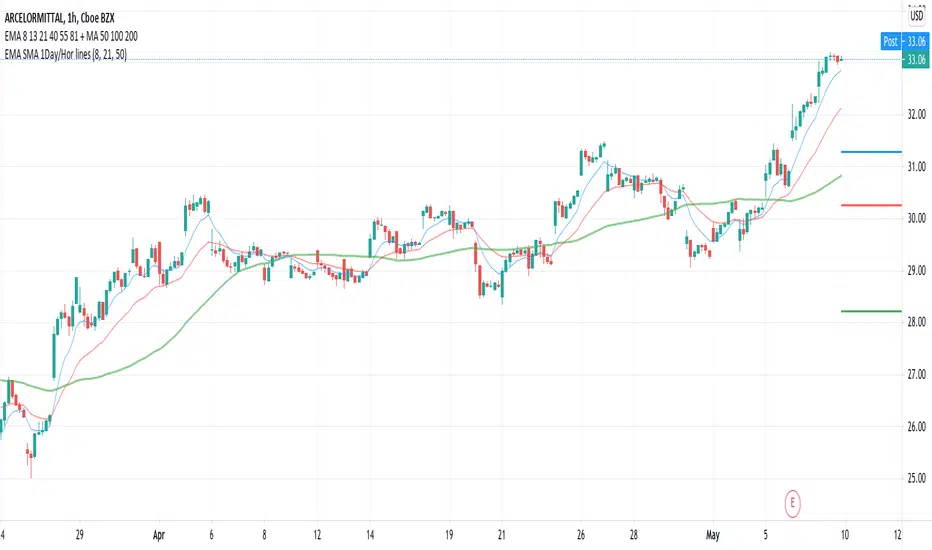
EMA 8, 21 and SMA 50 from daily timeframe horizontal linesShow horizontal lines after the last point of EMA8, EMA21 and SMA50 from daily timeframe. Always shows the daily lines no matter the timeframe of your chart. It can be use as a reference in intraday time frames lower than 1 day. Muestra líneas horizontales que continúan del último punto del EMA8, EMA21 y SMA50. Siempre muestra las líneas diarias sin importar el rango de tiempo que estés utilizando. Se puede usar como líneas de referencia para intradía.指標由pacoed80提供6389
Morun Astro Trend MAs cross StrategyAstrology machine learning cycles indicator signals with technical MAs indicators strategy, based on signals index of Github project github.com策略由citlacom提供已更新 9787
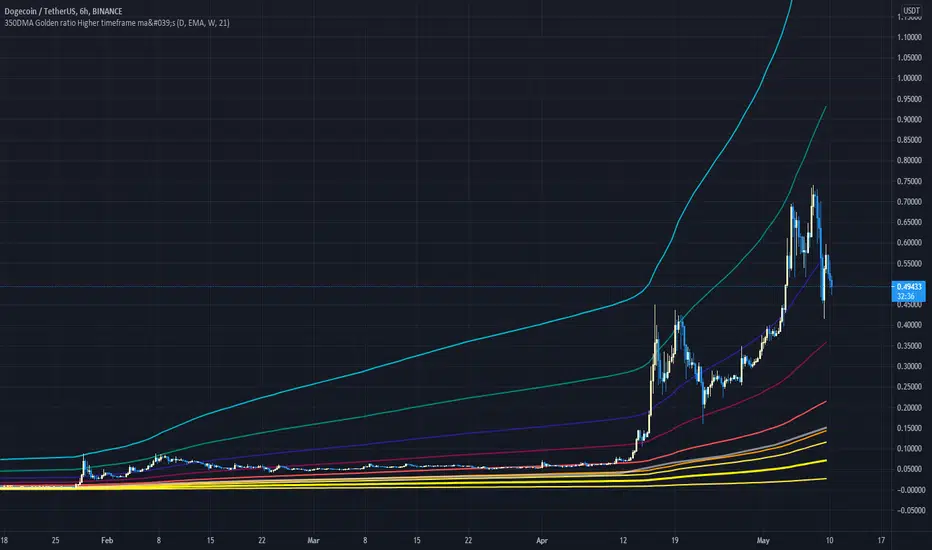
350DMA Golden ratio Higher timeframe ma'sThis Script take a 350 day moving average (bright yellow line) and multiplies it by the golden ratio 1.6... and by the Fibonacci sequence (0, 1, 2, 3, 5) It is a great tool for finding tops and critical supports on higher timeframes. The script also includes and higher timeframe ma (gray line) that can be set to your liking (default is 21 week). 指標由melodicfish提供已更新 94
Universal MA BandThis universal Moving Averages Band allows you to configure 2 independent MA with a tinted band between them. It is unique in that it allows you to configure each one separately: separate Resolution, Period and Type (SMA or EMA). Recommended bands for BTC: 50D SMA/EMA 100D SMA/EMA 20W SMA / 21W EMA指標由stonemonk提供97
Average Trading Range Percentage Average high/low trading range for the current timeframe. Daily high/low trading range. 指標由PaulP82提供已更新 47
Moving Average BandsUse this script to find buy and sell zones for BTC based on momentum of the move relative to the average asset price over a given period. The script plots a series of offset bands above and below the Simple Moving Average. When price crosses another band further from the SMA, the background is rendered brighter. The brighter the background, the stronger the buy and sell signal is, as the expectation is that price wants to return to the SMA. Settings are adjustable to fine tune to various time f指標由Seltzer_提供122
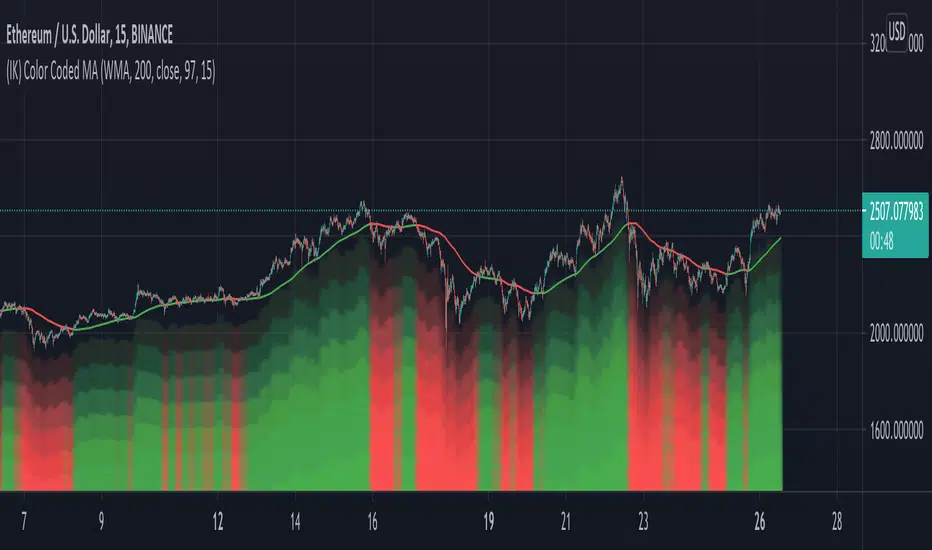
(IK) Color Coded MAJust a simple Moving Average indicator. Choose between SMA, EMA, and WMA, set the length and the source. There are 3 color indicators that represent whether price is above or below the moving average: - the moving average line itself - the background of the chart (optional) - the 'underglow' of price action (optional - set 'underglow strength' to 0 to turn off) You can customize the colors I wasn't planning on publishing this, because, again, it doesn't really do anything special, but I've bee指標由tapRoot_coding提供110
Candle Percent Volatility by AllenlkThis indicator gives you the percentage movement of each candle. Measurements are taken between the candle High point and Low point, and also between the Open and Close and calculated in percent %. From there it smooths out the data with a moving average. This gives you an idea of how much volatility is within each candle given the time resolution of the chart. I like to use this information as a way to turn off a strategy, or select a proper time resolution for a strategy. If each candle has l指標由allenlk提供294
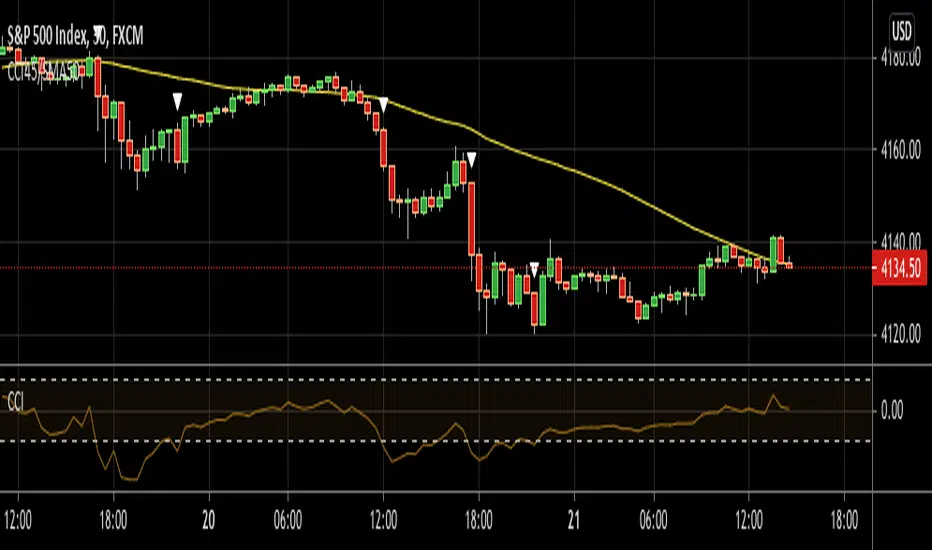
CCI45/SMA50 indy for 30 min SP500SPCFD:SPX The script determines entry points using 45 period CCI and 50 period SMA. Long condition: When CCI crosses up 150 treshold while price above 50 period SMA Short condition: When CCI crosses down -150 treshold while price below 50 period SMA Trades are executed above/below 1 point of high/low for long/short positions. Stops are just 1 point below/above of SMA. After 4 points of profit stops should be tightened. If you do not plan to hold the position for a long time, it can produce 指標由GurselKona提供223
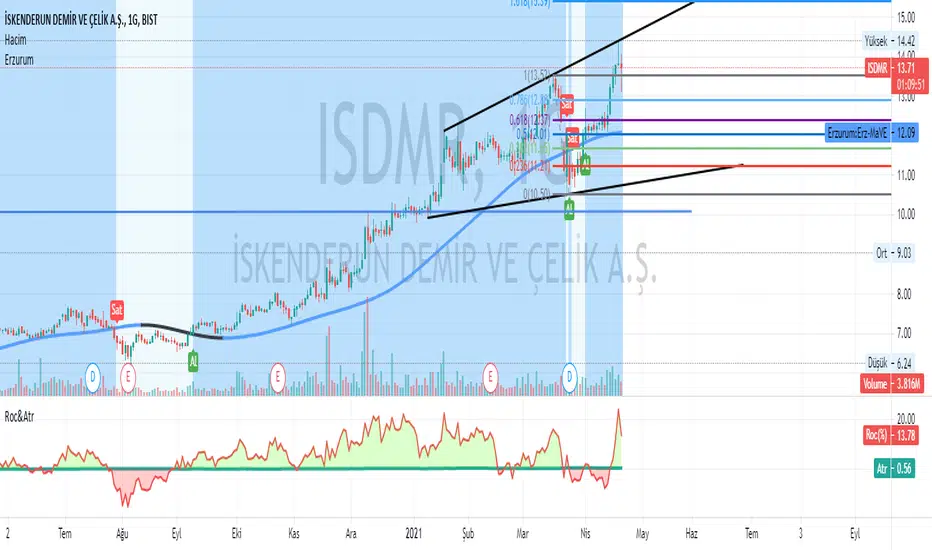
Erzurum Indicators (By DadashKadir)Erzurum Indicators (By DadashKadir) An indicator in which you will keep track of the buying and selling movements by adding the movements of the three moving averages together. The parameters were determined as Moving Average (SMA), Exponential Moving Average (EMA), Weighted Moving Average (WMA) and Volume Weighted Moving Average (VWMA). Its constant value was taken as WMA. It is used to calculate the averages of 3 - 5 and 7. You can include the standard deviation (STDEV) in these moving averag指標由dadashkadir提供1149
Ultimate Buy/Sell IndicatorAn Indicator based on the William Alligator, helping to find suitable entry and exit points.指標由cryptowatri提供已更新 14 2.9 K
Moving Averages For All Timeframes [LevelUp]Manage moving averages, for every timeframe, from within one indicator. Features: ■ Intraday - Up to 3 moving averages ■ Daily - Up to 4 moving averages ■ Weekly - Up to 2 moving averages ■ Monthly - Up to 2 moving averages ■ Choose between simple, exponential or volume weighted moving averages (SMA, EMA or VWMA) 指標由LevelUpTools提供已更新 107 4.3 K
Lower Time Frame ScalperThis indicator is meant to identify lower timeframe momentum shifts in Forex pairs by using simple moving averages and the Kijun Sen indicator around key psychological levels. Alert functionality for buy and sell conditions have also been built in to allow the trader time away from charts. 指標由The_Trading_Jedi提供已更新 1209
RSKYVNThis indicator is a combination of ema and sma which is good for trend analysis. I put buy and sell signal in this indicator for an easy entry and exit. How to use it? First check our ma100. Ma100 shows trend analysis whether we are (uptrend and downtrend). Second just wait for our biuy and sell signal. This is profitable when ma100 is under our sma and ema region. So always wait that ma100 dive under ema and ma regions to enter a trade. Disclaimer: This indicator is only good when there is a指標由diestasj提供41
3SMA + Ichimoku 2leadlineThis indicator simultaneously displays two lines, which are the leading spans of the Ichimoku Kinko Hyo, and three simple moving averages. To make it easier to distinguish between the simple moving average line and the line of the Ichimoku Kinko Hyo, the simple moving average line is set to level 2 thickness by default. Also, the color of Reading Span 1 in the Ichimoku Kinko Hyo has been changed from green to lime to improve color visibility. I (author of this indicator) use this indicator espe指標由surumegohan提供1114
CT Moving Average Crossover IndicatorMoving Average Crossover Indicator Here I present a moving average indicator with 9 user definable moving averages from which up to 5 pairs can be selected to show what prices would need to be closed at on the current bar to cross each individual pair. I have put much emphasis here on simplicity of setting the parameters of the moving averages, selecting the crossover pairs and on the clarity of the displayed information in the optional “Moving Average Crossover Level” Information Box. What指標由The_Caretaker提供已更新 25 1.4 K
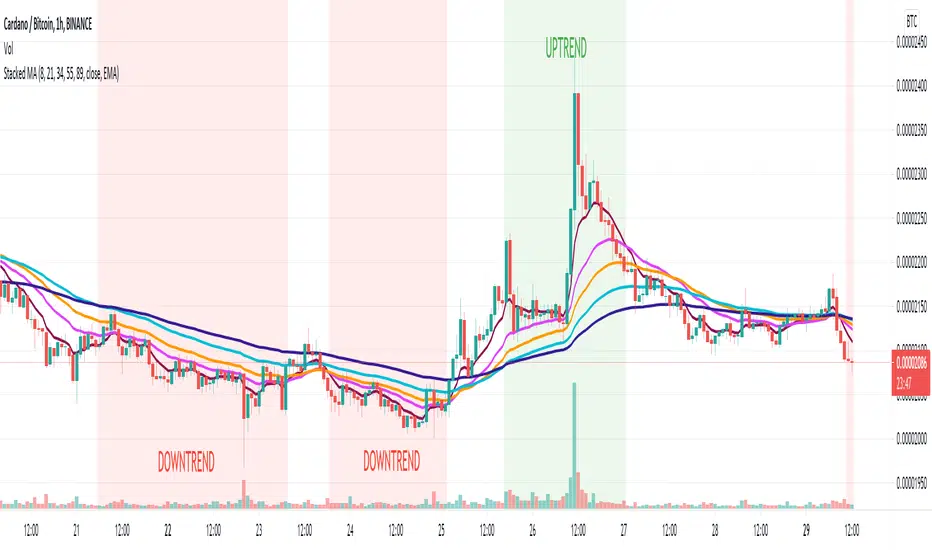
Stacked Moving AveragesThe Stacked Moving Averages indicator lets you see if a ticker is in an uptrend, downtrend, or no trend based on the condition of the moving averages. If the moving averages are stacked such that MA1>MA2>MA3>MA4>MA5, then that is described as an uptrend. If the moving averages are stacked such that MA5>MA4>MA3>MA2>MA1, then that is defined as a downtrend. The moving averages can be SMA, EMA, or DEMA, and it’s possible to view all the moving average series in the chart or hide all series and only指標由dvinales提供已更新 13393
Color Changing Moving Average Hello everybody! I'm not much of a coder but I do make indicators for myself for fun sometimes and found this one super cool. Hope it helps! Basically it's a moving average that changes colors based on the trend. How does it do it, you may ask? Simply put, it checks and makes sure that the open and close price is above the moving average, then it checks and sees if the 50-period RSI (length adjustable) is above 50. If both conditions are met, the moving average turns green. Simple as t指標由zathura643提供已更新 18 1 K