策略
簡單移動平均線(SMA)

Volume Split - Buy vs SellThis indicator allows visibility of absorption through viewing as buy and sell side volume. If each side is matched within a given percentage (you can select via a parameter), then the given volume bar will be highlighted. Additionally there is an alert on the SMA if the price action crosses the SMA, this is simply something I have been working on in combination.
Constructive thoughts and ideas are welcome.
PSA - AI was utilized in the making of this indicator.
指標

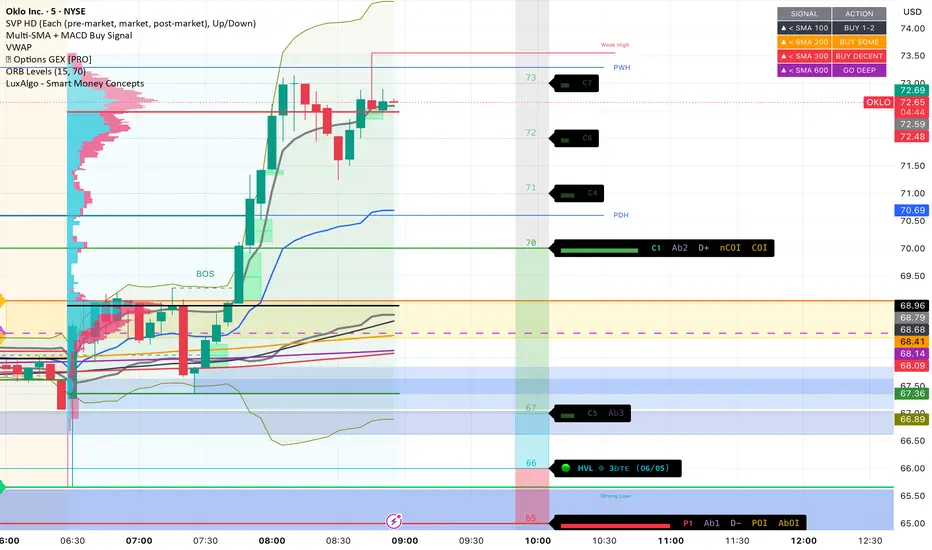
Multi-SMA + MACD Buy SignalSimple moving average based indicator for leap strategies on mag 7 type stocks, value buying stocks or leap plays, works really well with high conviction on day trading. Pictures added for signals
指標
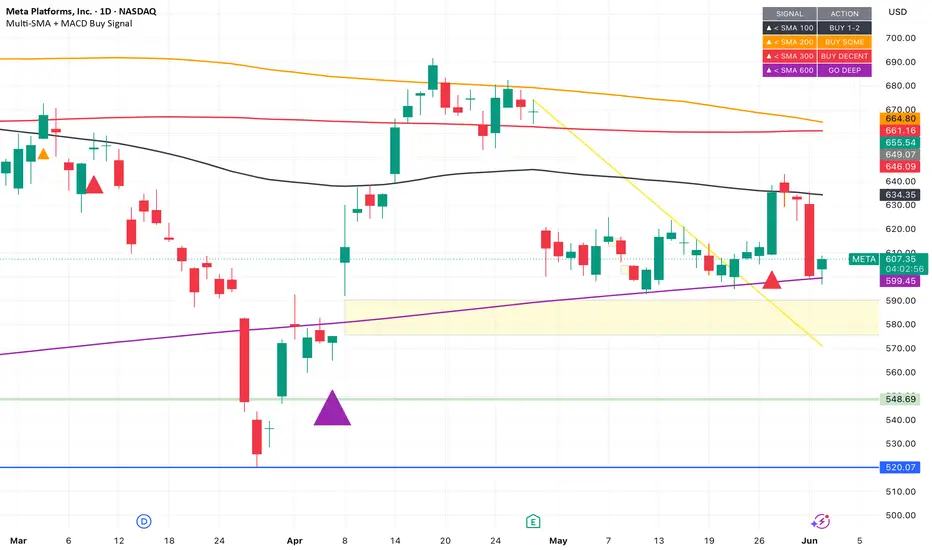
Multi-SMA + MACD Buy SignalSimple moving average based indicator for leap strategies on mag 7 type stocks, value buying stocks or leap plays, works really well with high conviction on day trading
指標
NTR: NASDAQ M1 - Trend RunnerNASDAQ M1 - MACD Trend Runner is a systematic trend continuation strategy specifically designed and optimized for the NASDAQ index on the 1-minute timeframe.
The strategy was developed around a simple observation:
Strong directional movements in NASDAQ often emerge after temporary pullbacks toward key moving averages while underlying momentum remains intact.
Instead of attempting to predict reversals or market turning points, the objective of this framework is to identify favorable re-entry o
策略

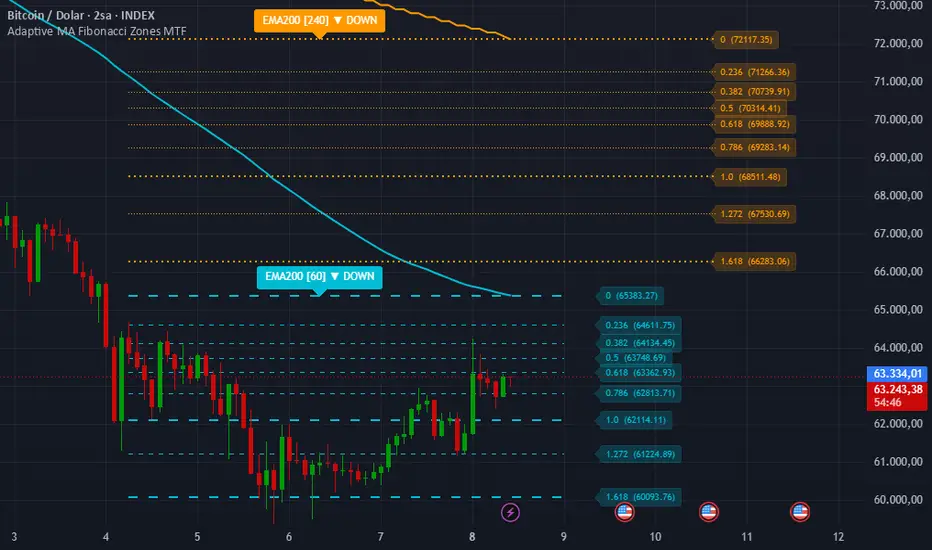
Adaptive MA Fibonacci Zones MTF# Adaptive MA Fibonacci Zones MTF
Adaptive MA Fibonacci Zones MTF is a multi-timeframe technical analysis tool that projects Fibonacci-based price levels around a selected moving average.
The indicator allows traders to choose from multiple moving average types, including EMA, SMA, WMA, SMMA, DEMA, TEMA, HMA, VWMA, ALMA, and KAMA. Two independent higher timeframes can be analyzed simultaneously, making it easier to compare trend structure and potential reaction zones across different market pe
指標
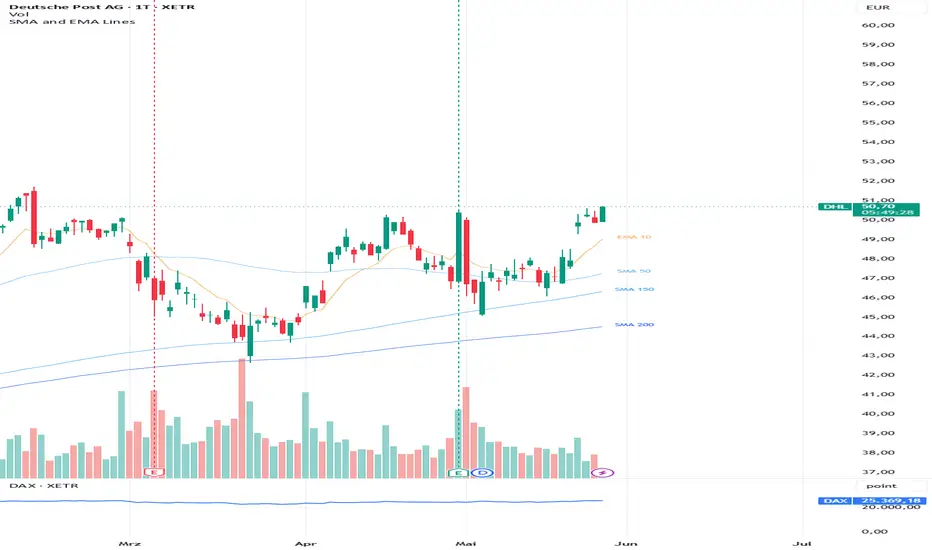
Moving averages. JB styleMoving averages. JB style
A clean, configurable multi-MA overlay. Up to four moving averages, each colored by its own slope, with debounced crossover markers, weight-scaled line widths, an EMA/SMA switch, a regular-hours session lock, and five color palettes — all tuned so the indicator reads as a separate layer over your candles instead of blending into them.
WHAT IT DOES
- Up to 4 moving averages. Defaults are 9 / 21 / 50 / 200, and every slot has its own editable length and show/hide t
指標

Predictive SMA & BB■ Overview
Most technical indicators are strictly lagging—they only tell you what has already happened. The "Predictive SMA & BB" flips this paradigm by projecting the Simple Moving Average (SMA) and Bollinger Bands (BB) into the future space of your chart.
This tool allows you to visualize where dynamic support and resistance (the statistical walls) will be in the future, giving you a massive edge in planning limit orders and understanding the element of "time" in your trades.
■ The Core Logi
指標

Dual MA Gradient [Gabremoku]Dual MA Gradient is a clean dual moving average overlay designed to highlight not only MA direction and crossover, but also the degree of separation between the two averages through a dynamic gradient ribbon.
The script uses two configurable moving averages and transforms their relationship into a visual ribbon that reacts to:
bullish alignment
bearish alignment
neutral compression
Instead of relying only on a simple crossover, the indicator helps show whether the two averages are:
cross
指標

指標
65min 9MA Extension Clean TextDisplays a box on chart which shows current price extension from 65min 9ma. Primarily used when trading qqq or nq to prepare for eminent reversals. Turns green when extended more than .52% from ma to downside, turns red when extended to the upside.
指標
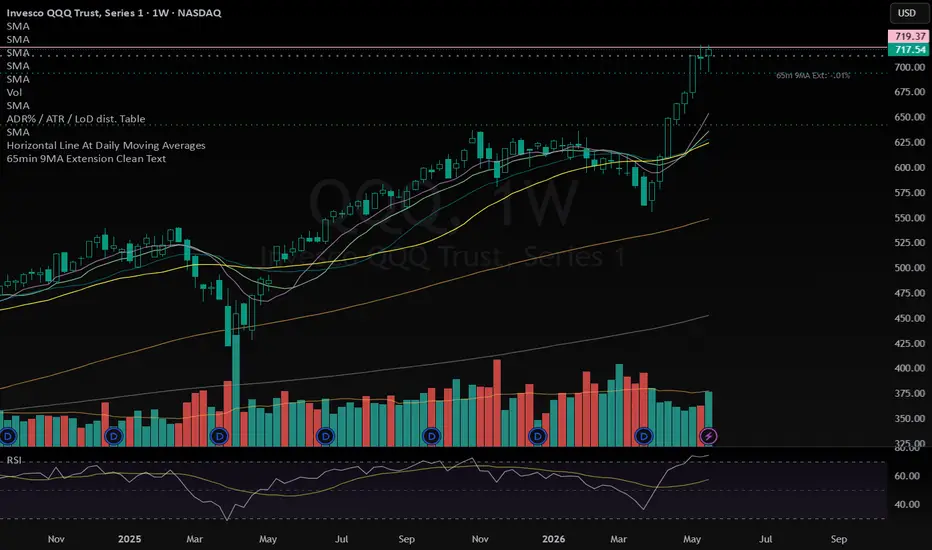
65min 9MA Extension Clean TextShows percent distance price is from 65min 9ma. Primarily used trading NQ or qqq where .52% extended from ma in either direction can indicate and eminent reversal. Turns green when extended to downside (prepare for reversal buy), turns red when extended to upside(prepare for potential sell reversal).
指標

MTIDDescription
MTID is an all-in-one overlay built for swing and position traders who want price action, key statistics and fundamentals on a single pane. Six configurable moving averages, a "big move" marker, a live stats dashboard, and an 8-quarter fundamentals table are combined into one indicator with independent toggles for every section.
WHAT'S ON THE CHART
• Six moving averages — each with its own length, type (SMA/EMA), color and timeframe-visibility filter (All / Intraday+Daily / Weekl
指標

dc_Swing Traders Setup v2This script/indicator allows the swing trader to easily setup multiple moving averages on their chart that are timeframe specific. The MA's automatically changes the underlying periods for you the MA's are smoothed and calculated on the intraday, ala Brian Shannon setup and others.
It shows the daily vwap intraday as well for entry tactics.
The tool also has a convenient info box to give the user a quick read on ADR, 50d extension, last earning and volume traded. Basically it is all you need f
指標

Multi-Timeframe MA Structure & RSI ConfluenceThis indicator combines multi-timeframe moving averages, RSI-based swing structure labels, and a compact RSI confluence panel into one chart overlay.
Features:
EMA/SMA 50 and 200 for 15m, 1h, 4h, Daily and Weekly timeframes
Optional automatic hiding of lower-timeframe MAs on higher-timeframe charts
EMA/SMA visual distinction using solid and dashed lines
RSI-based swing high/low labels: HH, HL, LH, LL
Developing swings marked with “?”
Structure-based label coloring: HH/HL green, LH/LL re
指標

Mean Reversion at or under 200MAThis strategy is based on the 30 minute of the S&P futures chart, MES
A Long Buy will be executed if, the EMA 9 or price comes down to or under the 200 MA, AND THEN the slope of the ema 9 subsequently changes from negative to positive.
The buy will be executed either; at a retest of the local lows (defined by the lowest wick between the most recent red candle that is subsequently followed by a green candle) (a retest is defined as 70% retrace from the local highs (inversely defined from local
策略

指標

指標

Amit Eth Strategy# MACD + EMA18 Signal Strategy
This strategy combines momentum and trend-following concepts using MACD, EMA, and SMA for clean directional trading signals.
## Strategy Logic
### BUY Setup
A BUY signal is generated when:
* MACD Line crosses above the Signal Line
* Price closes above the 18 EMA
### SELL Setup
A SELL signal is generated when:
* MACD Line crosses below the Signal Line
* Price closes below the 18 EMA
## Exit Rules
### For BUY Trades
Position exits when:
* Price closes bel
策略

Amit Eth StrategyMACD + EMA18 Signal Strategy
This strategy combines momentum and trend-following concepts using MACD, EMA, and SMA for clean directional trading signals.
Strategy Logic
BUY Setup
A BUY signal is generated when:
MACD Line crosses above the Signal Line
Price closes above the 18 EMA
SELL Setup
A SELL signal is generated when:
MACD Line crosses below the Signal Line
Price closes below the 18 EMA
Exit Rules
For BUY Trades
Position exits when:
Price closes below SMA 10 Low
OR
MACD gives bearis
策略

Moving Average XLMoving Average XL is a customizable multi-moving-average overlay that allows traders to plot up to three separate moving averages on the chart at the same time. Each moving average can be independently enabled, adjusted, styled, and color-coded, making it useful for trend direction, dynamic support and resistance, crossover analysis, and multi-timeframe-style trend context.
Each MA group includes the same core settings. “Show MA” turns that moving average on or off. “Length” controls the number
指標

MTF MA Switch (EMA/SMA)MTF MA Switch (EMA/SMA)
MTF MA Switch is a simple and flexible moving average indicator that displays up to six moving averages directly on the price chart.
The indicator shows four moving averages from the current chart timeframe and two additional moving averages from user-selectable timeframes. The moving average type can be switched globally between EMA and SMA.
Features:
- 4 moving averages based on the current chart timeframe
- 2 multi-timeframe moving averages
- Global EMA/SMA switch
-
指標
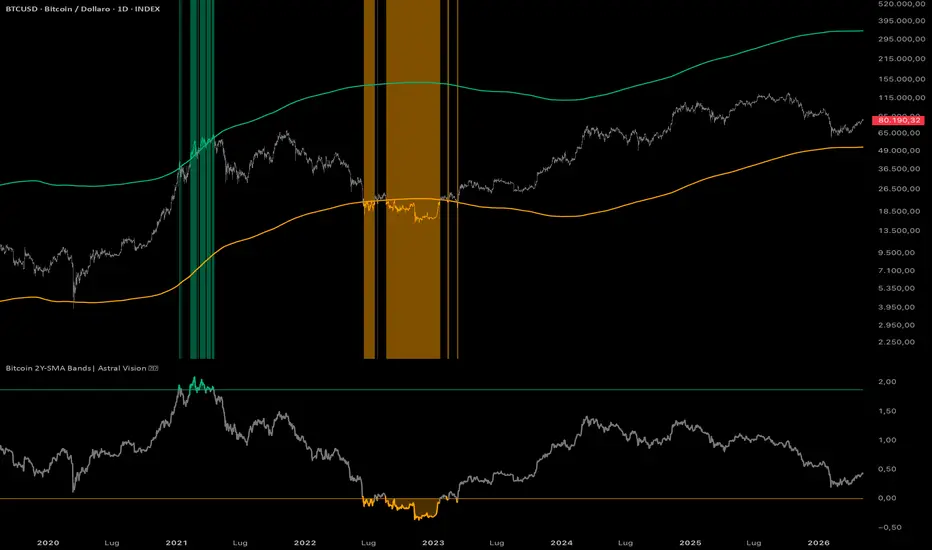
Bitcoin 2Y-SMA Bands| Astral Vision Bitcoin 2Y-SMA Bands | Astral Vision 🌠💠
The 2-year simple moving average spans a full halving epoch, filtering short and medium-term noise to expose Bitcoin's underlying long-term trend. This indicator builds a two-band valuation framework anchored to this baseline.
The bottom band scales the 2Y-SMA by a configurable multiplier (default 0.6), the level at which every major bear market has historically found its floor.
The top band scales from the bottom by a second multiplier (default 6.5),
指標
SMA 21, 50 y 200 All-in-One Script | Triple Moving Average📊 TRIPLE MOVING AVERAGE SCRIPT (3-in-1)
This script plots the 3 most important Simple Moving
Averages in a single indicator:
📈 MOVING AVERAGES INCLUDED
- SMA 21 → Short-term trend
- SMA 50 → Medium-term trend
- SMA 200 → Long-term trend
🎯 HOW TO USE
✅ Price above SMA 200 = Bullish bias
✅ SMA 21 crosses above SMA 50 = Buy signal
❌ SMA 21 crosses below SMA 50 = Sell signal
❌ Price below SMA 200 = Bearish bias
⚙️ FEATURES
- All 3 MAs in one single indicator
- Clean and simple visualization
-
指標
