Liquidity Vault [Dojo La Nuit]Liquidity Vault maps resting liquidity on your chart as clean horizontal levels and tracks what happens to them — without any buy/sell signals or predictions. It is a pure visualization tool for traders who read price around liquidity.
HOW IT WORKS
The script detects swing pivots and clusters nearby highs (and nearby lows) into single liquidity zones using an ATR-based tolerance, so the levels travel across instruments without re-tuning. Each zone gets a strength score from 0 to 100 built from three factors:
• Touches — how many times price reacted at the level
• Freshness — recent levels score higher and decay over time (configurable half-life)
• Volume — relative volume that accumulated at the level
HOW TO READ IT
• Red lines = sell-side liquidity (resting above price)
• Green lines = buy-side liquidity (resting below price)
• Opacity = strength: the stronger the zone, the more solid the line
• Dimmed, dotted lines = zones that have already been swept (price wicked through the level). They are kept as context, not removed.
SETTINGS
• Zone Detection — adaptive or fixed pivot length, clustering tolerance, lookback, max live zones
• Zone Strength — minimum score to display, freshness half-life, volume weighting on/off
• Visuals — theme (auto/dark/light), strength-based intensity, keep swept zones, line width
• Colors — fully customizable buy-side / sell-side colors
NOTES
Strength is shown through line opacity by design, to keep the chart minimal. Zones are recalculated on confirmed bars. This tool highlights where liquidity rests and when it gets taken — it does not generate entries, targets or signals.
This indicator is for educational and analytical purposes only. It is not financial advice. Always do your own research and manage your own risk.
─────────────────────────
🌙 LIQUIDITY VAULT — Dojo La Nuit
Liquidity Vault mostra la liquidità presente sul grafico come livelli orizzontali puliti e ne traccia l'evoluzione, senza segnali di acquisto/vendita e senza previsioni. È uno strumento puramente visivo per chi opera attorno alla liquidità.
COME FUNZIONA
Lo script individua i pivot di mercato e raggruppa i massimi (e i minimi) vicini in un'unica zona di liquidità tramite una tolleranza basata sull'ATR, così i livelli funzionano su strumenti diversi senza dover ritoccare i parametri. A ogni zona viene assegnato un punteggio di forza da 0 a 100, calcolato su tre fattori:
• Tocchi — quante volte il prezzo ha reagito al livello
• Freschezza — i livelli recenti pesano di più e si attenuano nel tempo (half-life configurabile)
• Volume — il volume relativo accumulato sul livello
COME SI LEGGE
• Linee rosse = liquidità sell-side (sopra il prezzo)
• Linee verdi = liquidità buy-side (sotto il prezzo)
• Opacità = forza: più la zona è forte, più la linea è piena
• Linee attenuate e puntinate = zone già spazzate (il prezzo ha bucato il livello con un'ombra). Restano come contesto, non vengono rimosse.
IMPOSTAZIONI
• Rilevamento zone — pivot adattivo o fisso, tolleranza di clustering, lookback, numero massimo di zone attive
• Forza zone — punteggio minimo da mostrare, half-life della freschezza, peso del volume on/off
• Visual — tema (auto/scuro/chiaro), intensità in base alla forza, mantieni zone spazzate, spessore linea
• Colori — colori buy-side / sell-side completamente personalizzabili
NOTE
La forza è rappresentata tramite l'opacità della linea, per scelta, per mantenere il grafico minimale. Le zone vengono ricalcolate sulle barre confermate. Lo strumento evidenzia dove si trova la liquidità e quando viene presa: non genera entrate, target o segnali.
Questo indicatore è a scopo puramente didattico e di analisi. Non è consulenza finanziaria. Fai sempre le tue valutazioni e gestisci il tuo rischio. 指標

Smart SR Zones [JOAT]SMART SR ZONES
Support / resistance done properly. Most public SR scripts paint a horizontal line at every pivot, which produces wallpaper, not analysis. Smart SR Zones does the opposite — pivots are first detected with a volatility-aware engine, then clustered into zones, then scored by volume and touches, then filtered by spacing and distance. What ends up on the chart is the small handful of levels that actually matter for the current market state.
Pivot detection — preset-driven
A single Strength Preset selects the personality of the pivot engine:
Scalp — 4 left / 2 right, 0.4× ATR clustering tolerance, 4-bar minimum spacing. For 1–5m charts.
Local — 6 / 4, 0.5×, 8-bar. Tight zones from recent structure.
Swing — 15 / 8, 0.9×, 20-bar. The balanced default.
Major — 35 / 15, 1.4×, 50-bar. Wide macro zones.
Custom — every parameter is exposed for manual tuning.
The preset abstraction means you do not need to refit anything across timeframes — pick the read you want and the engine does the rest.
Clustering, not stacking
When two pivots fall within Cluster Tolerance × ATR of each other they are merged into a single zone, with the box span widened to cover both extremes. This is the difference between a "level" and a "zone": a level pretends price is precise, a zone respects the fact that liquidity sits in a band. The cluster tolerance is ATR-relative so the same setting works across symbols.
Touch counting, properly gated
A pivot must contribute to a cluster from a minimum bar spacing (preset-driven). Without this filter a chop within a zone gets counted as ten separate touches and inflates the strength score. With it, a zone earns its touch count from genuinely independent visits.
Volume-weighted strength + star rating
Each cluster accumulates the bar volume at every contributing pivot. The aggregate is converted to a 1–3 star rating relative to the strongest zone currently on the chart, and is shown in the zone label alongside the touch count. Zones can optionally be coloured by volume share so the visually loudest box is the one carrying the most demonstrated activity.
Zone of Interest (ZOI) — the headline filter
A zone earns the ZOI badge when all of these are true at the same time:
It has met the minimum-touches threshold (so it is real structure).
Its volume share is above the ZOI volume threshold (so it is meaningfully active).
It has not been touched recently — at least ZOI Quiet bars since the most-recent touch.
In other words, a ZOI is a high-quality level that the market is conspicuously not testing — and these are usually the next levels that matter. The ZOI gets a bright burlywood border with an optional animated pulse so it visually separates from the rest of the SR stack.
Distance hiding
A "Hide zones farther than %" input drops anything whose centre price is too far from current — so when you scroll into history the chart does not get cluttered with macro zones from another era. Set to 0 to keep everything visible.
Broken zones and dropped zones
Two optional historical layers:
Broken — zones that were physically closed through. Renders in a desaturated palette so you can see where structure failed without confusing it for active level.
Dropped — zones that were removed not by a break but by reorganisation, because newer / stronger pivots reshuffled the cluster set.
Both are off by default so a working chart stays clean.
Optional signal layer
Three small markers (all off by default) for traders who want execution hints rather than just structure:
Successful test — circle on bars that touched an active zone and rejected.
Retest — diamond when price returns to a broken zone from the opposite side, inside a configurable window.
Zone reaction — small diamond on a touch-with-hold, plus a text label on physical break events.
A configurable cooldown prevents back-to-back markers from the same zone.
Dashboard
A compact diagnostic table, positionable to any of nine corners, monospaced. Shows nearest support / resistance with distance, current ZOI status, active zone count per side, and the preset in use. A compact mode hides descriptions for narrow layouts.
Alerts
A single high-signal alert is exposed: Zone of Interest activation — fires on the first bar a zone qualifies as a ZOI. The other layers are visual diagnostics, not alert-grade; this is intentional, because the ZOI rule is the strongest filter in the script and is what you actually want to be notified about.
How to read it
Look at the chart and ignore everything except the ZOI-tagged zones and the stars. The stars tell you which historical levels have the most demonstrated activity; the ZOI badge tells you which of those have been deliberately avoided recently. The intersection — a star-rated ZOI close to price — is the cleanest level read this script can produce. Use the volume score and the touch count as a tiebreaker when multiple ZOIs are in play.
Suggested settings
Default Swing preset works well from 1H through 1D on liquid futures, FX, and crypto. Drop to Local for intraday execution and Scalp for tape-reading on minute charts. Major is for weekly / monthly macro reads. The ZOI volume threshold (70%) is intentionally strict — drop it to 50–60% if you want more frequent ZOI candidates.
Originality / what's reused
The vocabulary (pivot, cluster, touch count, broken zone, retest) is public-domain market-structure language. The implementation — the preset-driven engine, the ATR-clustering, the volume-weighted star rating, the ZOI rule (touches + volume share + quiet-period), the dropped-zone reorganisation logic, and the volume-share intensity colouring — is JOAT-original and tuned together as a single system. No third-party code reused.
Open source
Published open-source under the default Mozilla Public License 2.0. The source is fully documented inline — every helper is sectioned, every input has a tooltip, and the structural layers are separable so you can learn from any specific piece. Forks welcome with credit.
Limitations
SR is structural context, not a signal generator. Smart SR Zones does not print buy / sell labels — it prints zones, ratings, and a single high-quality ZOI alert. On extremely illiquid instruments the volume-share rankings will be noisy and the ZOI rule will fire less often; that is the right behaviour. Zones beyond the Pivot Memory horizon are dropped to stay under TradingView's 500-object cap.
—
-made with passion by jackofalltrades
指標

Visible Range Volume NodesVisible Range Volume Nodes is a visible-range volume profile indicator that shows how traded volume is distributed across price levels inside the currently visible chart area.
The script builds a horizontal volume profile from the candles visible on the chart. It divides the visible price range into rows and distributes each candle's volume across the price rows touched by that candle's high-low range. Rows with more accumulated volume are displayed wider. Rows with less accumulated volume are displayed narrower.
How volume is calculated
Each candle's volume is distributed proportionally across the price rows covered by that candle's high-low range. If a candle covers several rows, its volume is split between those rows based on the amount of price overlap.
Bullish and bearish volume are separated using candle direction:
* Candles closing above their open are counted as bullish volume;
* Candles closing below their open are counted as bearish volume;
* Neutral candles are split evenly.
Key Volume Areas
POC - Point of Control
POC is the price row with the highest volume inside the visible range. It marks the largest volume concentration in the selected chart area.
VAH - Value Area High
VAH is the upper boundary of the value area.
VAL - Value Area Low
VAL is the lower boundary of the value area.
The value area starts from the POC and expands through the highest-volume neighboring rows until the selected percentage of total visible-range volume is included. By default, this is commonly used as a 70% value area, but the percentage can be changed in the settings.
HVN - High Volume Node
HVN zones are high-volume areas detected from local peaks in the smoothed volume profile. These zones show where volume was concentrated compared with nearby price levels.
LVN - Low Volume Node
LVN zones are low-volume areas detected from local valleys in the smoothed volume profile. These zones show where volume was thinner compared with nearby price levels.
How to use it
The profile can help users compare current price action with previously traded volume areas inside the selected visible range:
* POC shows the main high-volume reference area of the visible range;
* VAH and VAL show the upper and lower limits of the main value area;
* HVN zones show areas where price previously spent more volume;
* LVN zones show areas where volume was thinner relative to nearby price levels;
* The histogram shows the full volume distribution across the selected price range.
A trader can use these areas as context when analyzing price location. For example, price trading near POC is trading near the main volume concentration of the visible range. Price trading near VAH or VAL is trading near the edge of the calculated value area. HVN and LVN zones can be used to compare current price behavior with areas of stronger or weaker previous volume participation.
These levels should be treated as structural references only. They are not automatic entries, exits, support, resistance, targets, or invalidation levels.
Main settings
* Profile Rows controls how many price rows are used to build the volume profile. More rows create a more detailed profile. Fewer rows create a smoother, broader profile;
* Value Area % controls how much of the visible-range volume is included inside the value area;
* Histogram Direction controls whether the profile is displayed to the left or right side of the visible chart area;
* Profile Distance controls the spacing between the visible candles and the profile panel;
* The script also includes settings for showing or hiding POC, VAH/VAL, HVN, LVN, labels, prices in labels, line style, line width, label size, and colors.
Limitations
*This indicator does not generate buy or sell signals;
*It does not predict future price direction;
*It does not define guaranteed support or resistance;
*It does not use exact bid/ask volume;
*It does not use footprint, delta, or order book data.
The displayed structure depends on the selected visible range, symbol, exchange, timeframe, and available volume data.
Because the profile is based on the currently visible chart range, moving or zooming the chart can change the calculated POC, value area, HVN zones, and LVN zones.
指標

Liquidity Magnet ICT Liquidity & Sweeps [LunqFX]Liquidity Magnet is an ICT / Smart Money Concepts (SMC) liquidity indicator that maps buy-side and sell-side liquidity (BSL / SSL) and ranks every liquidity pool by how likely it is to be swept next. Instead of just drawing equal highs, equal lows and swing liquidity, it scores each resting pool of liquidity with a transparent 0–100 "Magnet Score" and highlights the single strongest draw on price as the NEXT TARGET — so you can anticipate the next liquidity sweep, stop hunt or liquidity grab before it happens.
If you trade ICT concepts, order flow, smart money, or supply and demand, this tool answers the one question every liquidity-based strategy needs: where is price most likely to go to take liquidity next?
WHAT IT DOES
• Detects liquidity pools automatically — swing highs / lows and equal highs / equal lows (EQH / EQL) where stop-losses cluster.
• Scores each pool 0–100 with the Magnet Score, a transparent weighted formula.
• Flags the strongest pool as the NEXT TARGET with a live arrow, price and probability.
• Marks pools as swept the moment price closes through them, then fades them.
• Shows a clean live dashboard: next target, probability, distance, bias and pool counts.
• Recolors the chart with neon gradient candles (turquoise bullish / violet bearish).
HOW THE MAGNET SCORE WORKS
The Magnet Score is fully transparent — no black box. Each unswept pool is graded on four weighted factors:
1. Proximity — how close the pool sits to current price (closer pulls harder).
2. Momentum — whether current momentum is moving toward the pool.
3. Age — how long the pool has rested untouched (older pools hold more liquidity).
4. Touches — how many times price has tagged the level (more taps = more stops stacked).
The four factors are combined into a single 0–100 score. The pool with the highest score, within a maximum distance from price, becomes the NEXT TARGET. If no pool is strong or close enough, the panel honestly reports "No clear magnet" instead of inventing a far-away target.
HOW TO USE IT
1. Read the BIAS in the panel — BUY-SIDE PULL means liquidity above is the draw (look for longs into the target); SELL-SIDE PULL means liquidity below is the draw (look for shorts).
2. Find the NEXT TARGET — the highlighted pool is where price is most likely to sweep liquidity next. Use it as a logical take-profit / objective.
3. Check the PROBABILITY bar — higher score = stronger magnet. Weak scores mean price is in a low-liquidity void; be patient.
4. Watch DISTANCE — how far the target is in %. Tight distance = an immediate objective; large distance = a swing objective.
5. Trade the sweep — as price reaches a pool and sweeps it, watch for the reaction. Swept pools fade automatically so the chart always shows live, unmitigated liquidity only.
Tip: combine the NEXT TARGET with your own entry model (FVG, order block, market structure). Liquidity Magnet tells you WHERE liquidity sits and which pool is the draw — you choose the entry.
THE DASHBOARD
• NEXT TARGET — price of the strongest liquidity pool and its probability.
• Probability bar — visual 0–100 strength of the current magnet.
• Distance — % distance from price to the target.
• Touches — how many times the target level was tested.
• Bias — overall liquidity pull (buy-side vs sell-side).
• Buy-side / Sell-side pools — count of active unmitigated pools on each side.
NON-REPAINTING
All liquidity pools are built from confirmed pivots (a fixed lookback of closed bars), and every sweep is confirmed on closed bars only — barstate.isconfirmed. Scores and visuals are display-side and never rewrite history. No request.security, no lookahead, no future leak. What you see is what actually happened.
SETTINGS
Liquidity Engine
• Swing length — pivot lookback; higher = only major swings become pools.
• Equal-level tolerance — how close two highs/lows must be (in ATR) to merge into one pool and count as a touch.
• Max pools per side — cap on active pools above and below.
• Max pool age — pools older than this are removed.
Magnet Score
• Proximity range, Momentum lookback / range — sensitivity of the score factors.
• Weights: proximity / age / touches / momentum — fully customizable scoring.
• Min score to flag target — hide weak magnets below this score.
• Max target distance % — a pool farther than this can never be the NEXT TARGET.
Neon Candles
• Neon gradient candles on/off, Glow halo on/off.
Panel
• Show panel, position, background / text / accent colors.
BEST USED ON
Forex, Gold (XAUUSD), indices, crypto and stocks. Works on all timeframes; intraday (15m–4H) is ideal for liquidity sweeps, higher timeframes for swing objectives.
Keywords: liquidity, liquidity sweep, liquidity pools, ICT, SMC, smart money concepts, buy-side liquidity, sell-side liquidity, BSL, SSL, equal highs, equal lows, EQH, EQL, stop hunt, liquidity grab, order flow, smart money, market structure.
This indicator is a decision-support tool, not financial advice. Always combine it with your own analysis and risk management.
指標

FVG Retest Entry Engine [trade_w_samet]🎯 FVG Retest Entry Engine
FVG Retest Entry Engine is a structured Fair Value Gap retest analysis indicator designed to help traders study confirmed gap reactions, structure alignment, filtered entry conditions, and multi-target visual trade models directly on the price chart.
This script focuses on one main concept:
FVG retest-based entry visualization.
It is not designed to be a simple buy/sell signal generator.
It is not designed to show every possible Fair Value Gap.
It is not designed to create constant chart noise.
Instead, the goal of FVG Retest Entry Engine is to detect confirmed structure events, identify eligible Fair Value Gaps, monitor their retests, apply configurable quality checkpoints, and visualize accepted setups using one entry level, one protective stop, and three take-profit levels.
The indicator includes:
• Bullish and bearish market-structure detection
• BOS and CHoCH classification
• Three-candle Fair Value Gap detection
• Internal FVG memory and invalidation handling
• Structure-linked FVG candidate selection
• FVG quality scoring and setup grading
• Armed-zone retest monitoring
• Multiple retest confirmation models
• Volume, Directional Force, and confirmed HTF bias filters
• FVG Retest Passport
• Blocker Lens state reporting
• Confirmed-close signal commitment
• Optional Live Preview dashboard state
• Gap-protected and ATR-based stop-loss models
• TP1, TP2, and TP3 risk-multiple projections
• Optional breakeven movement after TP1
• Active and historical TP / SL areas
• Executed FVG retest zones
• One-active-trade-at-a-time logic
• Mobile chart layout
• Multiple visual themes
• Advanced entry and lifecycle alerts
• JSON webhook support
• Compact bottom-right dashboard
The purpose of this script is to help users visually study where a structure event and an eligible Fair Value Gap combine with a confirmed retest condition.
It should be treated as a chart-analysis and educational decision-support tool.
It is not financial advice.
It is not an automated trading system.
It does not guarantee profitable trades.
It does not execute broker orders.
It does not replace personal analysis, risk management, or trade validation.
━━━━━━━━━━━━━━━━━━━━━━
📌 OVERVIEW
━━━━━━━━━━━━━━━━━━━━━━
At a high level, FVG Retest Entry Engine does the following:
• Detects confirmed bullish and bearish structure breaks.
• Classifies structure events as BOS or CHoCH.
• Detects bullish and bearish three-candle Fair Value Gaps.
• Stores valid FVG zones in internal memory.
• Tracks zone direction, boundaries, age, displacement, volume context, and prior interactions.
• Searches for an eligible FVG after a matching structure event.
• Scores and ranks available FVG candidates.
• Arms the best available zone for retest monitoring.
• Waits for the selected minimum retest delay.
• Detects the selected FVG retest pattern.
• Evaluates reaction quality and optional confluence filters.
• Assigns a setup grade such as A+, A, B, or FILTERED.
• Confirms final entry conditions only when the chart candle closes.
• Draws one Entry, one SL, and three TP levels.
• Tracks TP1, TP2, TP3, stop-loss, and breakeven events.
• Allows only one active trade projection at a time.
• Keeps completed trade areas when historical display is enabled.
• Marks completed models as bullish or bearish FVG Retest outcomes.
• Displays the current bias, engine state, and active levels in the dashboard.
• Provides entry, armed-zone, target, stop, breakeven, and webhook alert options.
The script is intentionally built as a structured process.
It does not include machine-learning prediction.
It does not include guaranteed performance claims.
It does not attempt to forecast every future market movement.
It provides a transparent way to study structure-linked FVG retests and their projected trade lifecycle.
━━━━━━━━━━━━━━━━━━━━━━
🧠 CORE IDEA
━━━━━━━━━━━━━━━━━━━━━━
The core idea behind FVG Retest Entry Engine is based on the relationship between market structure and Fair Value Gap reactions.
A Fair Value Gap represents a three-candle price imbalance.
A bullish FVG is formed when the current candle’s low is above the high from two candles earlier.
A bearish FVG is formed when the current candle’s high is below the low from two candles earlier.
The script does not treat every FVG as an entry.
Instead, it waits for a confirmed structure event and then searches for an eligible FVG that matches that directional context.
The selected FVG becomes an armed zone.
Price must later return to that zone and satisfy the chosen retest condition.
The engine can then evaluate:
• gap size relative to ATR
• formation displacement
• formation volume context
• FVG age
• prior zone interactions
• structure-break quality
• retest depth
• reaction-candle quality
• volume participation
• DI / ADX directional force
• confirmed higher-timeframe bias
• minimum setup grade
The goal is not to show more signals.
The goal is to create a documented and understandable process from structure event to confirmed FVG retest model.
━━━━━━━━━━━━━━━━━━━━━━
🧩 WHY THIS SCRIPT IS NOT A SIMPLE BUY/SELL INDICATOR
━━━━━━━━━━━━━━━━━━━━━━
FVG Retest Entry Engine is not intended to be used as a blind buy/sell system.
The script is structured as a visual review workflow:
Structure event is confirmed
→ matching FVG candidates are reviewed
→ one eligible FVG is selected
→ the FVG becomes armed
→ price returns to the armed zone
→ the retest pattern is checked
→ reaction quality is evaluated
→ enabled filters are checked
→ the setup receives a grade
→ the candle must close with all conditions still valid
→ Entry, SL, TP1, TP2, and TP3 are projected
→ the active model is monitored
→ the model closes at TP3, stop loss, targets complete, or breakeven
→ the completed FVG Retest model is archived visually
Each part has a specific purpose.
The structure system identifies a directional event.
The FVG memory system stores imbalance zones.
The candidate-ranking system selects a relevant gap instead of using every gap.
The armed-zone system separates observation from entry.
The retest logic defines what qualifies as a valid return.
The quality checkpoints reduce setups that fail enabled conditions.
The grading system summarizes internal setup quality.
The entry model provides visual planning levels.
The stop model creates a consistent risk reference.
The three-target model provides staged reward references.
The Blocker Lens explains the current engine state.
The Passport explains why an accepted setup qualified.
The alert system supports monitoring of confirmed events.
This makes the script a structured FVG retest analysis tool, not a guaranteed trade signal generator.
━━━━━━━━━━━━━━━━━━━━━━
⚙️ HOW THE SCRIPT WORKS
━━━━━━━━━━━━━━━━━━━━━━
The script operates through several connected stages.
First, it identifies confirmed swing highs and swing lows.
Price breaking a confirmed swing level can create a bullish or bearish structure event.
The break may be classified as BOS when it continues the current structure bias or CHoCH when it changes that bias.
The engine separately detects three-candle Fair Value Gaps and stores their contextual information.
bool tws_bullish_fvg = bar_index >= 2 and low > high
bool tws_bearish_fvg = bar_index >= 2 and high < low
float tws_bullish_fvg_top = low
float tws_bullish_fvg_bottom = high
float tws_bearish_fvg_top = low
float tws_bearish_fvg_bottom = high
float tws_bullish_fvg_size = tws_bullish_fvg_top - tws_bullish_fvg_bottom
float tws_bearish_fvg_size = tws_bearish_fvg_top - tws_bearish_fvg_bottom
When a structure event occurs, the engine reviews matching FVG candidates within the selected distance and timing limits.
The available candidates are compared using the active profile’s rules.
The selected zone becomes armed and remains under observation until:
• a confirmed retest creates an entry
• the setup expires
• the FVG is invalidated
• another structure search replaces it
Once price interacts with the armed zone, the selected retest model and reaction-quality conditions are checked.
Volume, DI / ADX, and higher-timeframe bias can also be required.
Only a setup that passes the active rules and remains valid at candle close can create a permanent entry model.
━━━━━━━━━━━━━━━━━━━━━━
🔵 BULLISH FVG RETEST LOGIC
━━━━━━━━━━━━━━━━━━━━━━
A bullish FVG Retest setup begins with bullish structure context.
The script requires a confirmed bullish BOS or CHoCH event and then searches for a directionally matching FVG candidate.
The selected zone must remain valid while the engine waits for price to return.
Depending on the chosen profile and retest model, bullish confirmation may require:
• wick contact with the zone
• real-body contact
• a close inside the zone
• a bullish reaction reclaim
• directional recovery above the zone midpoint
• a close above the relevant FVG edge
• a bullish rejection wick
The engine may then check:
• reaction strength
• volume participation
• positive DI dominance
• minimum ADX strength
• confirmed bullish HTF alignment
• minimum accepted grade
When every enabled condition remains valid at candle close, the script creates:
• a bullish FVG RETEST label
• an executed FVG retest box
• an entry reference at the confirmation close
• a protective stop below the setup reference
• TP1, TP2, and TP3 above entry
• blue reward visualization
• red risk visualization
This does not mean price must continue upward.
It means the script detected a bullish FVG retest condition that satisfied the selected rules at the time of confirmation.
━━━━━━━━━━━━━━━━━━━━━━
🔴 BEARISH FVG RETEST LOGIC
━━━━━━━━━━━━━━━━━━━━━━
A bearish FVG Retest setup begins with bearish structure context.
The script requires a confirmed bearish BOS or CHoCH event and then searches for a directionally matching FVG candidate.
The selected zone must remain valid while the engine waits for price to return.
Depending on the chosen profile and retest model, bearish confirmation may require:
• wick contact with the zone
• real-body contact
• a close inside the zone
• a bearish reaction reclaim
• directional recovery below the zone midpoint
• a close below the relevant FVG edge
• a bearish rejection wick
The engine may then check:
• reaction strength
• volume participation
• negative DI dominance
• minimum ADX strength
• confirmed bearish HTF alignment
• minimum accepted grade
When every enabled condition remains valid at candle close, the script creates:
• a bearish FVG RETEST label
• an executed FVG retest box
• an entry reference at the confirmation close
• a protective stop above the setup reference
• TP1, TP2, and TP3 below entry
• blue reward visualization
• red risk visualization
This does not mean price must continue downward.
It means the script detected a bearish FVG retest condition that satisfied the selected rules at the time of confirmation.
━━━━━━━━━━━━━━━━━━━━━━
💎 FVG QUALITY FILTER SYSTEM
━━━━━━━━━━━━━━━━━━━━━━
The script includes a multi-layer FVG quality system to reduce unnecessary chart signals.
This is important because not every gap has the same context and not every retest should create an entry model.
The quality system may evaluate:
• minimum gap size relative to ATR
• displacement of the formation candle
• gap location inside the recent dealing range
• formation-volume context
• gap age
• previous interactions with the zone
• distance from the matching structure event
• structure-break strength
• reaction-candle strength
• volume participation on retest
• DI / ADX directional force
• confirmed HTF bias
• final setup grade
The exact behavior depends on the selected Engine Style.
Original Sync uses the first validated calibration and star-based acceptance logic.
Balanced Flow uses moderate filtering.
Precision Flow applies stricter FVG and retest requirements.
Fast Flow accepts more active conditions.
Position Flow uses wider structural and timing windows.
Custom Lab exposes the advanced thresholds for manual configuration.
The filter system does not guarantee better future outcomes.
It controls how selective the engine is before creating a confirmed visual model.
━━━━━━━━━━━━━━━━━━━━━━
📏 GAP / ATR FILTER
━━━━━━━━━━━━━━━━━━━━━━
The gap-width filter measures the detected FVG against ATR.
This helps the engine reject extremely small imbalance zones relative to current market volatility.
A higher minimum gap-width value makes FVG storage and candidate selection more selective.
A lower value allows smaller gaps to enter the internal memory.
The filter is volatility-adjusted because the same absolute price distance can have different meaning across symbols and timeframes.
The active threshold depends on the chosen profile or Custom Lab value.
A larger gap is not automatically a better setup.
Gap size is only one component of the complete selection and retest process.
━━━━━━━━━━━━━━━━━━━━━━
🕯️ DISPLACEMENT QUALITY FILTER
━━━━━━━━━━━━━━━━━━━━━━
The displacement filter evaluates the directional body of the candle associated with FVG formation.
The formation body is compared with ATR and converted into a bounded internal score.
This helps the script distinguish a stronger directional imbalance from a gap created during weak or narrow price action.
When the Gap Impulse Check is enabled, an FVG must satisfy the selected displacement threshold before it is stored as a valid candidate.
A higher threshold reduces the number of eligible FVGs.
A lower threshold accepts more moderate formations.
The displacement score is an internal quality measurement.
It does not predict whether the zone will hold in the future.
━━━━━━━━━━━━━━━━━━━━━━
📊 REACTION STRENGTH FILTER
━━━━━━━━━━━━━━━━━━━━━━
The reaction-strength filter evaluates the candle that interacts with the armed FVG.
The score can include:
• close location inside the candle
• directional wick quality
• body size relative to ATR
• bullish or bearish candle direction
• penetration depth inside the FVG
The purpose is to separate a basic touch from a more structured directional response.
A higher minimum reaction-strength value requires a clearer response from the zone.
A lower value accepts more retest conditions.
Original Sync can use its original reaction logic without the same adaptive score requirement.
The reaction score is not a win probability.
It is a standardized way to evaluate whether the retest candle matches the selected profile’s quality requirements.
━━━━━━━━━━━━━━━━━━━━━━
🧼 CONFIRMED RETEST FILTER
━━━━━━━━━━━━━━━━━━━━━━
The confirmed-retest layer requires price to satisfy the active retest model and remain valid at candle close.
Available Original Sync reaction patterns include:
• Any Wick Contact
• Real Body Contact
• Close Within Gap
• Reaction Reclaim
Available adaptive reaction models include:
• First Contact
• Directional Recovery
• Edge Reclaim
• Rejection Wick
First Contact accepts basic interaction with the zone.
Directional Recovery requires directional behavior after the interaction.
Edge Reclaim requires price to close through the relevant boundary.
Rejection Wick applies a stricter wick-and-close response.
The script can also use an interaction margin to tolerate minor boundary differences.
A minimum delay prevents the engine from confirming a retest too soon after the structure event.
An expiry window prevents stale armed zones from producing entries too far from their original context.
Final entry commitment remains bar-close based.
━━━━━━━━━━━━━━━━━━━━━━
🎯 ENTRY MODEL
━━━━━━━━━━━━━━━━━━━━━━
When an armed FVG retest passes all enabled conditions, the script creates a visual entry model.
The entry reference is the close of the candle that confirms the retest.
Permanent entries, labels, boxes, and entry alerts are committed only after candle close.
tws_preview_ready := tws_eval_zone_touched and tws_eval_reaction_pass and tws_direction_filters_pass and tws_eval_grade_pass
bool tws_confirmed_entry = tws_preview_ready and barstate.isconfirmed
if tws_confirmed_entry
tws_long_signal := tws_armed_direction == 1
tws_short_signal := tws_armed_direction == -1
tws_entry_event := true
tws_trade_active := true
tws_trade_direction := tws_armed_direction
tws_trade_open_bar := bar_index
tws_trade_entry := close
Confirmed Close mode waits for the candle to finish before the dashboard treats the setup as an entry.
Live Preview can show that current conditions are ready while the realtime candle is still open.
The preview may change intrabar because the candle is unfinished.
It does not create a permanent historical entry model unless the setup remains valid when the candle closes.
The entry is a visual analysis reference.
It is not a broker order and does not require the user to enter a trade.
━━━━━━━━━━━━━━━━━━━━━━
🛑 ATR STOP-LOSS MODEL
━━━━━━━━━━━━━━━━━━━━━━
The script includes two stop-placement models.
Gap-Protected Stop uses the selected FVG boundary plus an ATR-based protective buffer.
For bullish setups, the stop is projected below the FVG.
For bearish setups, the stop is projected above the FVG.
Volatility Stop projects the stop at an ATR multiple from entry.
A minimum stop-distance percentage can prevent extremely narrow visual stops.
float tws_raw_stop =
tws_stop_mode == "Gap-Protected Stop" ?
(
tws_trade_direction == 1 ?
tws_armed_bottom - tws_atr * tws_fvg_stop_buffer_atr :
tws_armed_top + tws_atr * tws_fvg_stop_buffer_atr
) :
(
tws_trade_direction == 1 ?
tws_trade_entry - tws_atr * tws_atr_stop_multiplier :
tws_trade_entry + tws_atr * tws_atr_stop_multiplier
)
float tws_raw_stop_distance = math.abs(tws_trade_entry - tws_raw_stop)
float tws_guaranteed_distance = tws_trade_entry * tws_minimum_stop_percent / 100.0
float tws_final_stop_distance = math.max(tws_raw_stop_distance, tws_guaranteed_distance)
ATR is used because volatility changes across markets and timeframes.
A wider stop changes the projected risk distance and therefore also changes all three target levels.
The displayed SL is a visual planning level only.
It does not place or manage a real broker stop order.
━━━━━━━━━━━━━━━━━━━━━━
🎯 TAKE-PROFIT RR MODEL
━━━━━━━━━━━━━━━━━━━━━━
The script uses three take-profit levels.
Each target is calculated from the distance between entry and the original stop.
float tws_trade_risk = math.abs(tws_trade_entry - tws_trade_original_stop)
tws_trade_tp1 := tws_trade_direction == 1 ? tws_trade_entry + tws_trade_risk * tws_tp1_r : tws_trade_entry - tws_trade_risk * tws_tp1_r
tws_trade_tp2 := tws_trade_direction == 1 ? tws_trade_entry + tws_trade_risk * tws_tp2_r : tws_trade_entry - tws_trade_risk * tws_tp2_r
tws_trade_tp3 := tws_trade_direction == 1 ? tws_trade_entry + tws_trade_risk * tws_tp3_r : tws_trade_entry - tws_trade_risk * tws_tp3_r
The default concept is:
TP1 = first risk-multiple target
TP2 = second risk-multiple target
TP3 = final risk-multiple target
The exact R values can be adjusted in Position Architecture.
The script also contains visual position-share percentages for TP1, TP2, and TP3.
These shares are used by the internal lifecycle model.
They do not represent a broker account, real position size, or verified financial performance.
The RR settings only control projected visual distances.
They should not be interpreted as recommendations or guaranteed objectives.
━━━━━━━━━━━━━━━━━━━━━━
📦 ACTIVE TP / SL BOX SYSTEM
━━━━━━━━━━━━━━━━━━━━━━
When a confirmed FVG Retest entry appears, the script can draw a complete visual trade model.
The visual model includes:
• executed FVG retest zone
• entry line
• original stop line
• active stop line
• TP1 line
• TP2 line
• TP3 line
• red risk box
• blue reward box
• Entry price label
• SL price label
• TP1, TP2, and TP3 price labels
• bullish or bearish entry label
The active boxes extend to the right while the model is open.
When the model closes, the right edge is fixed at the closing candle.
If Keep Completed Trade Areas is enabled, completed boxes and lines remain visible for historical review.
The Completed Trade History Limit controls how many previous visual models are retained.
The TP area uses a blue-toned visual palette.
TP price labels use a different, darker background so they remain distinct from the reward box.
The SL area remains red for clearer risk separation.
━━━━━━━━━━━━━━━━━━━━━━
🚦 ONE ACTIVE TRADE AT A TIME
━━━━━━━━━━━━━━━━━━━━━━
The script includes one-active-trade-at-a-time logic.
If a trade model is active, the engine does not create another trade model until the current one closes.
The active model may close through:
• TP3
• targets complete
• stop loss
• breakeven exit
This design separates:
• FVG and structure detection
• trade-model creation permission
The engine can continue calculating market context while a model is active, but another entry model is not opened.
This helps prevent overlapping TP / SL areas and keeps the chart easier to interpret.
The one-active-model rule is a visual management decision.
It is not a restriction on the user’s personal trading activity.
━━━━━━━━━━━━━━━━━━━━━━
⚠️ SAME-CANDLE TP / SL HANDLING
━━━━━━━━━━━━━━━━━━━━━━
If a target and the active stop are both touched on the same candle, standard OHLC data cannot reveal the true intrabar sequence.
The script therefore includes two selectable assumptions:
Protective First
Target First
Protective First assumes the stop is processed before target events.
Target First processes available target events before the stop check.
bool tws_conservative_mode =
tws_intrabar_priority == "Protective First"
if tws_conservative_mode and tws_stop_touched
tws_trade_remaining_percent := 0.0
tws_close_trade := true
tws_close_reason := tws_trade_active_stop == tws_trade_entry ? "BREAKEVEN" : "STOP LOSS"
tws_final_exit_price := tws_trade_active_stop
else
if not tws_tp1_reached and tws_tp1_touched
tws_tp1_reached := true
tws_tp1_event := true
Protective First is the more conservative bar-based assumption.
Target First is more optimistic.
Neither option reproduces exact tick-by-tick broker execution.
The model does not include spread, slippage, commissions, latency, or partial-fill behavior.
━━━━━━━━━━━━━━━━━━━━━━
🏷️ FVG RETEST LABELS
━━━━━━━━━━━━━━━━━━━━━━
The script uses clear directional FVG Retest labels.
Bullish entry labels use:
🟢 FVG RETEST
📈 LONG
Bearish entry labels use:
🔴 FVG RETEST
📉 SHORT
Entry labels can also display:
• grade
• setup score
• FVG age
• retest depth
• Passport information
Completed-model labels emphasize that the closed model originated from an FVG retest.
A completed bullish model can display:
🟢 BULLISH FVG RETEST
🔒 MODEL CLOSED
🎯 close reason
⭐ grade
TP1 / TP2 / TP3 status
A completed bearish model uses the corresponding bearish wording and color.
The labels do not display USD profit or account-profit claims.
All chart labels use bold and italic text formatting.
The signal-label size can be adjusted from the settings.
━━━━━━━━━━━━━━━━━━━━━━
📍 FVG ZONE DISPLAY MODES
━━━━━━━━━━━━━━━━━━━━━━
The FVG display system includes three modes:
Hidden
Selected Gap
All Active Gaps
Hidden mode removes active FVG memory boxes from the chart while allowing the engine to continue calculating them internally.
Selected Gap shows only the FVG currently armed for retest monitoring.
All Active Gaps displays every currently stored and valid FVG zone.
Show Executed FVG Retests separately controls whether the FVG zone that created an entry remains highlighted as part of the trade model.
The selected display mode affects visual presentation only.
It does not change the underlying FVG calculations.
For the cleanest chart, Selected Gap is generally the most focused mode.
All Active Gaps can be useful for research but may create more chart density.
━━━━━━━━━━━━━━━━━━━━━━
🧹 FVG INVALIDATION
━━━━━━━━━━━━━━━━━━━━━━
The script can automatically remove invalidated FVG zones.
A bullish FVG may be invalidated when confirmed price action closes through the zone in the opposite direction.
A bearish FVG may be invalidated when confirmed price action closes through its opposite boundary.
An armed zone can also be cleared when:
• its retest window expires
• the zone exceeds the permitted lifetime
• the internal memory limit removes an older gap
• the active structure search is replaced
When an armed FVG becomes invalid, the Blocker Lens can display FVG INVALIDATED.
When the retest window expires, it can display SETUP EXPIRED.
Removing invalidated or stale zones helps prevent outdated FVGs from creating later entries outside their intended context.
Users can disable automatic invalidation removal if they prefer to retain more zones visually.
━━━━━━━━━━━━━━━━━━━━━━
📟 DASHBOARD
━━━━━━━━━━━━━━━━━━━━━━
The script includes a compact dashboard positioned in the bottom-right corner.
The dashboard displays:
• BIAS
• STATE
• ENTRY
• TP1
• TP2
• TP3
• SL
BIAS uses the confirmed higher-timeframe filter when that filter is enabled and valid.
Otherwise, it reflects the current internal structure bias.
STATE is powered by the Blocker Lens.
Possible states include:
• WAITING STRUCTURE
• SCANNING FVG
• NO ELIGIBLE FVG
• FVG ARMED
• RETEST DELAY
• WAITING RETEST
• VOLUME BLOCK
• DI BLOCK
• HTF BLOCK
• WEAK REACTION
• GRADE BLOCK
• LIVE PREVIEW READY
• WAITING BAR CLOSE
• TRADE ACTIVE
• COOLDOWN
• SETUP EXPIRED
• FVG INVALIDATED
The dashboard size can be set to Micro, Compact, or Standard.
The dashboard is designed to summarize engine state and current price references.
It is not a performance report.
It is not a replacement for TradingView Strategy Tester.
━━━━━━━━━━━━━━━━━━━━━━
🚨 ALERT SYSTEM
━━━━━━━━━━━━━━━━━━━━━━
FVG Retest Entry Engine includes advanced alert options for:
• FVG armed
• bullish FVG Retest entry
• bearish FVG Retest entry
• any FVG Retest entry
• TP1 reached
• TP2 reached
• TP3 reached
• breakeven activated
• stop loss
• breakeven exit
Alert packages include:
Off
Qualified Entries
Premium Entries
Full Lifecycle
Webhook JSON
Qualified Entries focuses on confirmed accepted entries.
Premium Entries applies stricter grade-based alert delivery.
Full Lifecycle includes entry and management events.
Webhook JSON sends structured event messages for external processing.
Alert Direction can be limited to Both Directions, Bullish Only, or Bearish Only.
Minimum Alert Grade can be set to All Qualified, A / A+, or A+ Only.
Alert filtering affects alert delivery only.
It does not change the chart’s signal calculations.
alertcondition(tws_armed_alert_event, title="trade_w_samet • FVG ARMED", message='trade_w_samet FVG ARMED | {{ticker}} | TF: {{interval}} | Score: {{plot("SIGNAL_SCORE")}}')
alertcondition(tws_entry_alert_event and tws_trade_direction == 1, title="trade_w_samet • BULLISH FVG RETEST", message='trade_w_samet BULLISH FVG RETEST | {{ticker}} | TF: {{interval}} | Score: {{plot("SIGNAL_SCORE")}} | Entry: {{plot("ENTRY")}} | SL: {{plot("SL")}} | TP1: {{plot("TP1")}} | TP2: {{plot("TP2")}} | TP3: {{plot("TP3")}}')
alertcondition(tws_entry_alert_event and tws_trade_direction == -1, title="trade_w_samet • BEARISH FVG RETEST", message='trade_w_samet BEARISH FVG RETEST | {{ticker}} | TF: {{interval}} | Score: {{plot("SIGNAL_SCORE")}} | Entry: {{plot("ENTRY")}} | SL: {{plot("SL")}} | TP1: {{plot("TP1")}} | TP2: {{plot("TP2")}} | TP3: {{plot("TP3")}}')
alertcondition(tws_tp1_alert_event, title="trade_w_samet • TP1 REACHED", message='trade_w_samet TP1 REACHED | {{ticker}} | TP1: {{plot("TP1")}}')
alertcondition(tws_stop_alert_event, title="trade_w_samet • STOP LOSS", message='trade_w_samet STOP LOSS | {{ticker}} | SL: {{plot("SL")}}')
Alerts are monitoring tools only.
They do not execute trades or place broker orders.
━━━━━━━━━━━━━━━━━━━━━━
🔔 HOW TO USE ALERTS
━━━━━━━━━━━━━━━━━━━━━━
A practical alert workflow:
1. Add FVG Retest Entry Engine to the chart.
2. Select the desired Engine Style and confirmation settings.
3. Open TradingView’s alert window.
4. Select the indicator as the alert condition.
5. Choose the desired entry or lifecycle condition.
6. Select the alert frequency appropriate for confirmed-candle monitoring.
7. Use the Alert Package, direction, and grade controls inside the indicator when needed.
8. Add a webhook URL only when using a compatible external workflow.
9. Test the alert configuration before depending on it.
10. Confirm every event with personal analysis and risk management.
For confirmed entry monitoring, users should avoid treating provisional realtime candle conditions as permanent signals.
Entry alerts are designed around the script’s confirmed event variables.
Alert delivery can still depend on TradingView servers, the user’s alert configuration, data availability, and any external webhook destination.
━━━━━━━━━━━━━━━━━━━━━━
🧪 HOW TO USE THE INDICATOR
━━━━━━━━━━━━━━━━━━━━━━
A practical workflow:
1. Add FVG Retest Entry Engine to a standard candlestick chart.
2. Begin with Original Sync or Balanced Flow.
3. Keep Signal Timing on Confirmed Close for the clearest workflow.
4. Use Selected Gap to keep the chart focused.
5. Observe the dashboard STATE value.
6. Wait for a confirmed structure event and an armed FVG.
7. Review the FVG zone before the retest occurs.
8. When price returns, allow the selected retest model and filters to complete.
9. Review the FVG Retest Passport when an entry appears.
10. Use the displayed Entry, SL, TP1, TP2, and TP3 as visual references only.
11. Evaluate whether the setup fits personal structure, liquidity, session, and risk rules.
12. Use alerts for monitoring rather than blind execution.
13. Review completed FVG Retest labels to understand the model lifecycle.
14. Test settings on the exact markets and timeframes personally studied.
The indicator is best used as a structured FVG retest review tool.
It should not be used as an automatic decision-maker.
━━━━━━━━━━━━━━━━━━━━━━
⚙️ SETTINGS REFERENCE
━━━━━━━━━━━━━━━━━━━━━━
⚡ Signal Blueprint
Engine Style
Controls the active configuration profile.
Available profiles:
Original Sync
Balanced Flow
Precision Flow
Fast Flow
Position Flow
Custom Lab
Allow Bullish Setups
Enables or disables bullish FVG Retest models.
Allow Bearish Setups
Enables or disables bearish FVG Retest models.
━━━━━━━━━━━━━━━━━━━━━━
🪪 Retest Experience
FVG Retest Passport
Controls whether Passport information is Off, Compact, or Detailed.
Show Blocker Lens
Shows or hides the engine STATE explanation in the dashboard.
Signal Timing
Selects Confirmed Close or Live Preview behavior.
Live Preview affects the dashboard’s provisional realtime state. Permanent entries remain candle-close confirmed.
━━━━━━━━━━━━━━━━━━━━━━
🧬 Original Sync Engine
Original Signal Calibration
Selects Manual Sync, Bitcoin Map, Ethereum Map, Solana Map, or Gold Map.
Structure Window
Controls pivot sensitivity in Manual Sync.
Minimum Gap Footprint — ATR
Controls the minimum FVG width.
Gap Lifetime
Controls how long stored FVGs remain eligible.
Gap Memory Capacity
Controls the number of stored zones.
Break-to-Gap Distance
Controls the maximum allowed distance between structure context and FVG eligibility.
After-Break Scan Window
Controls how long the engine continues searching after a break.
Reaction Pattern
Selects Any Wick Contact, Real Body Contact, Close Within Gap, or Reaction Reclaim.
Reaction Margin %
Adds tolerance around FVG boundaries.
Minimum Reaction Delay
Controls how many bars must pass before retest confirmation.
Reaction Expiry Bars
Controls how long the armed setup may wait.
Participation Multiplier
Controls the Original Sync volume requirement.
Minimum Directional Force
Controls the Original Sync ADX threshold.
Minimum Sync Rating
Controls the minimum accepted star rating.
Minimum Risk Distance %
Prevents extremely narrow stops.
━━━━━━━━━━━━━━━━━━━━━━
🧭 Structure Pulse
Structure Sensitivity
Controls pivot detection in Custom Lab.
Display Structure Tags
Shows or hides BOS / CHoCH labels.
Close-Lock Breaks
Requires a candle close beyond structure when enabled.
Break Momentum Check
Requires directional expansion on the break candle.
Break Body Threshold — ATR
Controls the required break-candle body size.
Break Clearance — ATR
Adds an ATR-based buffer beyond the structure level.
━━━━━━━━━━━━━━━━━━━━━━
🧱 Gap Intelligence
Minimum Gap Width — ATR
Controls the minimum stored FVG size.
Gap Impulse Check
Enables displacement filtering.
Minimum Gap Impulse
Controls the required formation displacement.
Minimum Gap Score
Controls the minimum candidate-quality score.
Allowed Prior Reactions
Controls how many previous zone interactions are accepted.
Gap Expiry Bars
Controls maximum FVG age.
Active Gap Capacity
Controls stored-zone capacity.
Maximum Structure Link
Controls the maximum structure-to-FVG distance.
Break Follow-Through Window
Controls post-break candidate scanning.
Delete Invalidated Gaps
Removes zones invalidated by confirmed opposite price action.
━━━━━━━━━━━━━━━━━━━━━━
🎯 Reaction Trigger
Reaction Model
Selects First Contact, Directional Recovery, Edge Reclaim, or Rejection Wick.
Gap Interaction Margin %
Adds tolerance around FVG boundaries.
Minimum Reaction Strength
Controls the required retest-candle score.
Reaction Delay Bars
Controls the minimum delay before retest confirmation.
Setup Expiry Bars
Controls how long the armed zone remains available.
Signal Cooldown Bars
Controls the delay after a completed model before another entry is permitted.
━━━━━━━━━━━━━━━━━━━━━━
🛂 Quality Checkpoints
Volume Participation Check
Enables or disables the retest-volume filter.
Volume Baseline Length
Controls the volume moving-average period.
Required Volume Expansion
Controls the required volume multiplier.
Directional Force Check
Enables or disables DI / ADX filtering.
Directional Force Length
Controls the DI period.
Trend Strength Smoothing
Controls ADX smoothing.
Minimum Trend Strength
Controls the required ADX value.
Higher-Timeframe Bias Check
Enables or disables HTF directional alignment.
Bias Timeframe
Selects the higher timeframe.
Bias Fast EMA
Controls the fast HTF EMA length.
Bias Slow EMA
Controls the slow HTF EMA length.
Minimum Setup Grade
Selects B Grade or Better, A Grade or Better, or A+ Only.
The HTF layer uses previous completed higher-timeframe values.
float tws_htf_close = request.security(
syminfo.tickerid,
tws_htf_timeframe,
close ,
barmerge.gaps_off,
barmerge.lookahead_on
)
float tws_htf_fast_ema = request.security(
syminfo.tickerid,
tws_htf_timeframe,
ta.ema(close, tws_htf_fast_length) ,
barmerge.gaps_off,
barmerge.lookahead_on
)
float tws_htf_slow_ema = request.security(
syminfo.tickerid,
tws_htf_timeframe,
ta.ema(close, tws_htf_slow_length) ,
barmerge.gaps_off,
barmerge.lookahead_on
)
━━━━━━━━━━━━━━━━━━━━━━
🛡️ Position Architecture
ATR Calculation Length
Controls ATR calculation.
Stop Placement Model
Selects Gap-Protected Stop or Volatility Stop.
Volatility Stop Multiplier
Controls ATR stop distance from entry.
Gap Stop Buffer — ATR
Controls the protective distance beyond the FVG.
Minimum Stop Distance %
Prevents extremely narrow risk zones.
TP1 Risk Multiple
Controls the first target distance.
TP2 Risk Multiple
Controls the second target distance.
TP3 Risk Multiple
Controls the final target distance.
TP1 Position Share %
Controls the internal visual share assigned to TP1.
TP2 Position Share %
Controls the internal visual share assigned to TP2.
TP3 Position Share %
Controls the internal visual share assigned to TP3.
Move Stop to Entry After TP1
Moves the active stop to entry after TP1 according to confirmed lifecycle rules.
Same-Candle Priority
Selects Protective First or Target First.
━━━━━━━━━━━━━━━━━━━━━━
🎨 Chart Design
Color System
Selects Obsidian Signal, Carbon Grid, Ivory Pulse, Neon Voltage, Acid Circuit, or Violet Flux.
Gap Display Mode
Selects Hidden, Selected Gap, or All Active Gaps.
Show Executed FVG Retests
Shows or hides the FVG zone used by a confirmed trade model.
Display TP / SL Areas
Shows or hides the reward and risk boxes.
Keep Completed Trade Areas
Keeps completed model boxes and lines.
Completed Trade History Limit
Controls the maximum historical visual models.
Active Area Projection
Controls the initial right-side projection length.
Chart Layout
Selects Desktop or Mobile.
Signal Label Size
Selects Micro, Compact, Standard, or Large.
Dashboard Size
Selects Micro, Compact, or Standard.
Display Bias EMA
Shows or hides the confirmed HTF fast EMA reference.
Display Setup Dashboard
Shows or hides the bottom-right dashboard.
━━━━━━━━━━━━━━━━━━━━━━
📡 Alert Center
Alert Package
Selects Off, Qualified Entries, Premium Entries, Full Lifecycle, or Webhook JSON.
Alert Direction
Selects Both Directions, Bullish Only, or Bearish Only.
Minimum Alert Grade
Selects All Qualified, A / A+, or A+ Only.
Alert When FVG Is Armed
Enables armed-zone alerts for compatible packages.
Alert When Stop Moves to Entry
Enables breakeven-activation alerts for compatible packages.
━━━━━━━━━━━━━━━━━━━━━━
🧠 WHAT MAKES THIS SCRIPT ORIGINAL
━━━━━━━━━━━━━━━━━━━━━━
FVG Retest Entry Engine uses familiar analytical concepts such as:
• Fair Value Gaps
• swing-point structure
• BOS and CHoCH
• ATR
• volume analysis
• DI / ADX
• higher-timeframe EMA bias
• risk/reward projection
• staged targets
• breakeven management
These concepts are not unique by themselves.
The originality of this script lies in how they are organized into a transparent FVG retest workflow:
Structure confirmation
→ directional FVG memory
→ contextual candidate comparison
→ selected armed zone
→ configurable retest validation
→ reaction-quality evaluation
→ optional volume, DI, and HTF checkpoints
→ setup grading
→ confirmed-close entry commitment
→ three-target visual management
→ optional breakeven movement
→ completed FVG Retest archiving
→ Blocker Lens state reporting
→ Passport explanation
→ lifecycle alerts
Distinctive implementation features include:
• structure-linked FVG selection instead of signaling every gap
• multiple Engine Style profiles
• Original Sync market calibrations
• an armed-zone state before entry
• candidate ranking using several FVG characteristics
• multiple retest models
• a visible reason when an entry is waiting or blocked
• a Passport explaining accepted setup context
• confirmed-close permanent signal commitment
• previous-completed HTF values
• executed FVG zone preservation
• three-stage target management
• Desktop and Mobile display modes
• alert filtering separated from chart calculations
This structure is designed to provide a focused and explainable review process without relying on hidden prediction claims.
━━━━━━━━━━━━━━━━━━━━━━
⚠️ IMPORTANT PRACTICAL NOTES
━━━━━━━━━━━━━━━━━━━━━━
The script’s behavior depends heavily on settings and market conditions.
Signal frequency and visual output may change based on:
• Engine Style
• structure sensitivity
• close-based or wick-based breaks
• break momentum requirements
• minimum FVG width
• displacement filtering
• candidate-score threshold
• previous zone interactions
• FVG lifetime
• retest model
• reaction-strength threshold
• retest delay
• setup expiry
• volume filter settings
• DI / ADX settings
• HTF timeframe and EMA lengths
• minimum setup grade
• stop model
• target multiples
• signal cooldown
• timeframe
• symbol volatility
• market session
• available historical bars
A setting that appears clean on one market may behave differently on another.
A profile that produces suitable frequency on one timeframe may be too strict or too active on another.
Volume behavior can differ across asset classes and data providers.
Higher-timeframe filtering only operates as intended when the selected bias timeframe is genuinely higher than the chart timeframe.
Users should test the exact symbol, timeframe, profile, and session they personally study.
━━━━━━━━━━━━━━━━━━━━━━
⚠️ LIMITATIONS AND SHORTCOMINGS
━━━━━━━━━━━━━━━━━━━━━━
This script has important limitations:
It does not guarantee profitable trades.
It does not predict future price movement.
It does not replace risk management.
It does not execute trades.
It does not place broker orders.
It does not include broker slippage.
It does not include commissions.
It does not include spreads.
It does not include execution delay.
It does not include partial-fill behavior.
It uses bar-based chart data.
Same-candle TP / SL order cannot be known from standard OHLC data.
Same-Candle Priority is a modeling assumption.
Live Preview can change intrabar because the realtime candle is unfinished.
Permanent entry models are committed only after bar close.
Confirmed pivots require future bars before becoming available as confirmed swing points.
The dashboard is not TradingView Strategy Tester.
The internal target-share model is not account-performance reporting.
Historical boxes and completed labels do not guarantee similar future behavior.
Setup grades are internal classifications, not win probabilities.
Filter settings do not guarantee improved future results.
Higher-timeframe values depend on selected timeframe and available data.
Data-feed revisions or chart-history differences can affect historical calculations.
Alert delivery depends on TradingView and the user’s alert configuration.
Webhook delivery also depends on the external destination.
One-active-trade logic is a visual management rule, not broker execution logic.
For these reasons, FVG Retest Entry Engine should be used as an educational decision-support and chart-analysis tool, not as a standalone automated trading strategy.
━━━━━━━━━━━━━━━━━━━━━━
👤 WHO THIS SCRIPT MAY BE USEFUL FOR
━━━━━━━━━━━━━━━━━━━━━━
This script may be useful for traders who:
• study Fair Value Gap retests
• use BOS and CHoCH context
• prefer selected FVGs instead of every raw gap
• want a visible armed-zone workflow
• want to understand why a setup is waiting or blocked
• prefer confirmed-close entries
• want a setup-grade framework
• want Entry, SL, TP1, TP2, and TP3 visualization
• want optional breakeven behavior
• want completed FVG Retest models preserved visually
• use higher-timeframe directional context
• want mobile-friendly chart presentation
• use lifecycle alerts for monitoring
• want a structured educational analysis framework
It may be less suitable for users who:
• want guaranteed buy/sell signals
• want a fully automated trading bot
• want every raw FVG to create an entry
• expect one profile to work on every market
• expect grades to represent guaranteed probability
• require exact tick-level execution simulation
• expect visual projections to match broker fills
• expect alerts to execute trades automatically
• want an indicator to replace independent decision-making
━━━━━━━━━━━━━━━━━━━━━━
🧭 BEST PRACTICE SUGGESTIONS
━━━━━━━━━━━━━━━━━━━━━━
For cleaner review:
• Start with Original Sync or Balanced Flow.
• Keep Signal Timing on Confirmed Close.
• Use Selected Gap to reduce chart clutter.
• Enable Blocker Lens while learning the engine workflow.
• Use Compact Passport for concise context.
• Use Detailed Passport when reviewing why a setup qualified.
• Review the armed FVG before the entry appears.
• Check whether the FVG retest agrees with personal market-structure analysis.
• Evaluate the displayed stop against nearby structure and volatility.
• Treat TP1, TP2, and TP3 as planning references only.
• Keep Protective First when a conservative same-candle assumption is preferred.
• Use Precision Flow when fewer, stricter setups are preferred.
• Use Fast Flow only after understanding its higher signal frequency.
• Use Custom Lab only after learning how each threshold affects the engine.
• Use Mobile layout on smaller screens.
• Use alerts for monitoring, not blind execution.
• Always apply independent analysis, risk management, and position sizing.
━━━━━━━━━━━━━━━━━━━━━━
🔓 PUBLICATION NOTE
━━━━━━━━━━━━━━━━━━━━━━
FVG Retest Entry Engine is published as an educational and visual market-analysis tool.
The purpose of this description is to explain:
• what the script does
• how structure events are confirmed
• how three-candle FVGs are detected
• how FVGs are stored and invalidated
• how structure and FVG candidates are linked
• how an FVG becomes armed
• how retest models work
• how reaction quality is evaluated
• how volume, DI / ADX, and HTF checkpoints operate
• how setup grades are assigned
• how Confirmed Close and Live Preview differ
• how Entry and stop levels are calculated
• how TP1, TP2, and TP3 are projected
• how breakeven and same-candle assumptions work
• how active and completed trade areas behave
• what the Passport and Blocker Lens show
• what the dashboard displays
• what the alert packages do
• what the limitations are
• how the indicator should and should not be used
The script is designed to support structured analysis.
It does not promise profitable results.
It does not remove market risk.
It does not execute trades.
It should not be used as a blind buy/sell system.
It is best used as a visual framework for reviewing structure-linked FVG retests and projected risk/reward behavior.
━━━━━━━━━━━━━━━━━━━━━━
🛡️ DISCLAIMER
━━━━━━━━━━━━━━━━━━━━━━
FVG Retest Entry Engine is provided for educational and informational purposes only.
It does not constitute financial, investment, trading, legal, or tax advice.
No indicator can guarantee future results.
Markets are uncertain, conditions change, and historical behavior does not ensure future performance.
Every user is responsible for their own analysis, validation, risk management, position sizing, alert configuration, trading decisions, and broker execution.
The structure labels, FVG zones, armed-zone states, Passport values, Blocker Lens messages, grades, scores, entry references, stop-loss levels, take-profit levels, TP / SL boxes, dashboard values, completed-model labels, and alerts are visual analysis tools only.
Use this script as a structured decision-support and visual review framework, not as a promise of profitability or a substitute for independent judgment.
指標

ICT AMD Session Map [EmpArchitect]█ OVERVIEW
ICT AMD Session Map maps the observed Accumulation–Manipulation–Distribution sequence inside configurable London or New York session cycles.
The script first builds and locks an accumulation range. After the range is complete, it watches for a confirmed sweep beyond one boundary and a close back inside. Distribution is shown only when price later moves away with displacement and closes through a frozen internal structure reference.
It maps confirmed session structure. It does not provide entries, exits, targets, stop losses, or trade signals.
█ WHAT IT MAPS
Accumulation:
A range is built during the configured accumulation window. The range updates on confirmed chart bars and becomes fixed when the window closes.
Sweep:
After the range is locked, price must penetrate beyond one boundary by the selected ATR threshold and close back inside the full range.
The script distinguishes:
• Buy-side sweep
• Sell-side sweep
• Dual sweep — ambiguous
Distribution:
Distribution is marked only after a valid one-sided sweep, directional displacement, and the first confirmed close through an internal structure level frozen at the time of the sweep.
A buy-side sweep can lead to bearish distribution.
A sell-side sweep can lead to bullish distribution.
These labels describe observed session structure. They are not forecasts or trade instructions.
█ FORWARD-ONLY STATE MODEL
Each cycle moves through a forward-only state sequence:
Idle
→ Accumulation building
→ Range locked
→ Sweep observed
→ Distribution observed
A cycle can also finish as ambiguous when both sides are swept.
Not every cycle produces all three AMD phases. A session may finish with only a locked range or a sweep without confirmed distribution. The script does not force a Distribution label when confirmation is absent.
█ SESSION PRESETS
New York preset:
• Accumulation: 07:00–08:30 America/New_York
• Sweep / distribution window: 08:30–11:00 America/New_York
London preset:
• Accumulation: 05:00–07:00 Europe/London
• Sweep / distribution window: 07:00–10:00 Europe/London
Custom mode allows both windows and the session timezone to be configured manually.
IANA timezones are used so New York and London presets adjust for daylight-saving changes.
█ CONFIRMATION FILTERS
• Minimum sweep penetration measured against ATR
• Full-range close-back-inside requirement
• Directional displacement body threshold
• Minimum body-to-range ratio
• Confirmed internal pivot structure reference
• Frozen break level at sweep time
• Distribution confirmation only after the sweep bar
• Dual-side sweep detection
█ DASHBOARD
The top-right dashboard shows the current cycle:
• Cycle preset
• Current state
• Sweep direction
• Distribution state
• Session timezone
The dashboard describes the active cycle only.
Historical boxes and labels remain visible after the active cycle finishes, while the dashboard returns to Idle / outside cycle.
█ ALERTS
Included context alerts:
• Accumulation range locked
• Buy-side sweep observed
• Sell-side sweep observed
• Bullish distribution observed
• Bearish distribution observed
• Dual sweep — ambiguous
• Cycle ended without confirmed distribution
Alerts describe confirmed session structure only. They are not trade signals.
█ IMPORTANT LIMITATIONS
• Designed for liquid intraday markets
• Best reviewed on 1M–15M charts
• Session boundaries become less precise on higher chart timeframes
• Results depend on the selected session windows, timezone, ATR filters, and pivot sensitivity
• A detected phase does not predict continuation or reversal
• “Distribution” describes a confirmed structural phase, not a recommendation to trade in that direction
█ NOTES
• Pine Script v6
• Open-source
• Works with London, New York, and custom session cycles
• Historical retention is configurable
• Built by EmpArchitect
• Educational structure-context tool only
• Not financial advice
• Not a signal service
指標

CandelaCharts - Order Blocks📝 Overview
The CandelaCharts - Order Blocks indicator identifies high-probability supply and demand zones based on ICT (Inner Circle Trader) and Smart Money Concepts (SMC) . An ICT Order Block represents the specific candle where institutional liquidity was injected to reverse the market, acting as a magnet for future price action. This indicator not only highlights these crucial institutional footprints but dynamically tracks how deeply they have been mitigated by future price action.
📦 Features
Precision Detection : Identifies both Bullish and Bearish Order Blocks using advanced pivot tracking and multi-timeframe logic.
Dynamic Mitigation Tracking : Displays the precise percentage of the unmitigated zone remaining. The block visually updates as price pierces deeper into the zone, leaving a solid background on the unmitigated portion and a faded background where price has already traded.
Wick vs Close Logic : Customize exactly how mitigation is calculated. Choose to invalidate and measure mitigation depth using candle wicks or strict candle closes.
Clean Chart Mechanics : Built-in filtering removes overlapping blocks, keeping your chart tidy and focusing on the most relevant levels.
Customizable Aesthetics : Full control over block borders, mean lines (mid-lines), text formatting, and alignment settings (Full, Middle, Accurate, Precise, Sequence).
⚙️ Settings
Show : Toggles the visibility of the entire indicator.
History : Adjust the maximum number of historical Order Blocks to display simultaneously.
Alignment : Controls how the top and bottom bounds of the block are calculated (e.g., Full Candle, Accurate, Precise, Sequence).
Mitigation Toggle & Mode : Enable or disable the visual percentage display. Choose Wick or Close to determine how mitigation depth and block invalidation are calculated.
Timeframe : Lock the Order Blocks to a specific timeframe, or leave it dynamic.
Show Border : Toggle borders and customize their style/width.
Show Mean : Toggle the mean line (midline) of the blocks and customize its style/width.
Text Size : Toggle the text display and choose the desired text size. When toggled off, the block type label is hidden, but the mitigation percentage cleanly aligns to the right.
Hide Overlap : When enabled, removes redundant order blocks that share the same price region.
⚡️ Showcase
Order Blocks
Mitigation
Mean Line
🚨 Alerts
The indicator includes fully integrated dynamic alerts that can be captured using the "Any alert() function call" condition, as well as standard alert conditions:
New Bullish/Bearish Order Block : Triggers the moment a new valid order block is confirmed.
Order Block Touch : Triggers when a candle pierces or enters an active, unmitigated order block.
⚠️ Disclaimer
Trading involves significant risk, and many participants may incur losses. The content on this site is not intended as financial advice and should not be interpreted as such. Decisions to buy, sell, hold, or trade securities, commodities, or other financial instruments carry inherent risks and are best made with guidance from qualified financial professionals. Past performance is not indicative of future results.
指標

指標

FVG Toolkit [Smart Money]A Fair Value Gap is a 3-candle imbalance: a candle runs hard and leaves a void that the candles around it never fully cover. But the version most tools draw is only one of three the price-action crowd actually watches. There is the visible Classic gap, the Implied gap hidden inside a single oversized candle, and the Inversion gap that appears when a broken FVG flips and starts acting as support or resistance. Tracking these one type at a time means three layers of clutter and a lot of switching back and forth. FVG Toolkit detects all three on one overlay and merges their overlap into a single confluence zone, so the chart shows structure instead of noise.
HOW IT WORKS
Three FVG families, each independently toggleable, are detected on confirmed bars only:
- **Classic FVG** — the standard visible 3-candle imbalance: the wicks of candle 1 and candle 3 do not overlap, leaving an open gap (bullish `low > high `, bearish `high < low `).
- **Implied FVG** — a hidden imbalance carried by a single large candle whose outer wicks overlap. The gap is measured between the Consequent Encroachment (the 50% level) of those outer wicks. This is ElisTools' operational definition of an Implied FVG; the ICT community uses several variants, so this one is stated openly rather than presented as the only version.
- **Inversion FVG** — a Classic FVG whose boundary gets broken flips polarity and becomes a support/resistance zone: a bearish FVG broken upward becomes a bullish IFVG, and a bullish FVG broken downward becomes a bearish IFVG.
Each gap is then managed through an honest lifecycle:
- **Classic / Implied** are shown as a full zone. When price reaches the far edge the gap is violated and removed (or kept, your choice). There is no partial-fill shading — a zone is either present or gone.
- **Inversion** runs on two independent axes. Validation is the flip itself (the Classic boundary is broken, by Wick or Body) and births the IFVG; Invalidation is the opposite boundary being broken (by Wick or Body) and removes it. Because the two axes are separate, you can flip strictly and invalidate loosely, or any other mix.
- **Cluster** — when a fresh same-direction Classic FVG forms over an existing IFVG (a common displacement byproduct), the two are merged into one reinforced union zone spanning their full combined extent. This is confluence, not a BPR. Cluster priority is direction-aware: a cluster takes precedence only over overlapping standalone zones of the same direction — an opposite-side gap is never touched.
A `Min gap size (ATR x)` filter skips trivial micro-gaps, and Inversion inherits it (a filtered-out Classic can never flip). Every zone can carry an optional 50% (CE) line and label, with its own per-type and per-side colors.
1) A confirmed bar is scanned for Classic, Implied, and Inversion conditions (each only if enabled)
2) Surviving gaps are drawn as full zones; a same-direction Classic over an IFVG is merged into a cluster
3) Price reaching a far edge violates Classic/Implied; a broken boundary validates or invalidates an Inversion
HOW TO READ
- A Classic zone is a visible 3-candle imbalance; an Implied zone marks the void inside one oversized candle; an Inversion zone is a former gap now flipped to the other side.
- A cluster (its own color) is a same-direction Classic and IFVG stacked together — overlap collapsed into one zone rather than two competing ones.
- The optional 50% line is the Consequent Encroachment, the midpoint many price-action traders watch inside a gap.
- "Bullish" and "Bearish" describe the direction of the pattern, not a buy or sell instruction. Marking any of these zones says nothing about whether price will fill it, hold there, or reverse. The tool maps the structure; the read is yours.
INPUTS
- Max zones / Extend right — how many zones to keep on chart, and how far to project them.
- Min gap size (ATR x) — skip gaps smaller than this multiple of ATR(14); 0 turns the filter off. Inversion inherits it.
- Show Classic / Show Implied / Show Inversion — enable each family independently; each has its own color(s).
- Middle body >= ATR x (Implied) — how large the single middle candle must be to qualify as an Implied gap.
- Validation (flip) — how a Classic flips into an IFVG: Body (a body closes beyond the boundary, ICT-strict, default) or Wick (a wick beyond it, looser).
- Invalidation — how a formed IFVG is removed: Wick (a wick beyond the opposite boundary, default) or Body (a body close beyond it, ICT-strict).
- Remove on violation / Violation by — drop a Classic/Implied zone when its far edge is reached; Wick (intrabar) or Close (bar close).
- Merge same-dir overlap — fuse a same-direction Classic + IFVG into one cluster zone; with its own cluster color.
- Style — show labels, show 50% (CE) line and its width, zone border and its width.
ALERTS
Two layers, set up separately in the alert dialog.
- Detection (four conditions: New bullish/bearish Classic FVG and New bullish/bearish Implied FVG) are picked from the condition dropdown and fire on closed bars — use "Once Per Bar Close."
- Lifecycle (FVG inverted, Inversion FVG invalidated, FVG mitigated) fire through alert() function calls — create them with "Any alert() function call." Use "Once Per Bar" when the matching axis is set to Wick, and "Once Per Bar Close" when it is set to Body or Close.
NOTES & LIMITS
This is an observation tool, not a forecast. Marking a Classic, Implied, or Inversion FVG says nothing about whether the gap fills, holds, or reverses — it only shows where the structure sits. The Implied FVG uses ElisTools' operational definition (a large middle body, overlapping outer wicks, and the gap measured between their 50% levels); the ICT community uses several variants, so this one is stated openly rather than claimed as the single canon. The cluster is a confluence union of a same-direction Classic and IFVG, not a Balanced Price Range, and it never removes an opposite-side gap. No repaint, no lookahead: zones are created on confirmed (closed) bars only and their levels never move. Wick-based lifecycle rules update intrabar but stay exact, because a bar's high and low are running extremes that are never revised; Body and Close rules act only on bar close. No profit, win-rate, or guarantee claim. Open-source under CC BY-NC-SA 4.0 — non-commercial use, attribution to ElisTools required for reuse or derivatives. TradingView (Pine v6) only.
指標

HTF Session Sweep ModelHTF Session Sweep Model
The HTF Session Sweep Model is a session-based market structure tool designed to help traders observe how price interacts with the previous confirmed higher-timeframe candle during active trading sessions.
This script was created because session trading can become messy when traders manually mark multiple highs, lows, opens, boxes, sweeps, breakouts, and traps across different timeframes. Instead of adding unrelated indicators together, this model uses one central reference point: the previous confirmed HTF candle. Once an enabled session begins, the script maps that HTF candle’s high, low, midpoint, and optional session open level onto the chart. Price action during that session is then classified around that reference range.
The purpose of the script is not to predict price. The purpose is to provide a clean framework for reading session behaviour around a higher-timeframe range.
Core Concept
The script is built around the idea that the previous higher-timeframe candle can provide useful reference levels for intraday price behaviour. Its high and low can act as areas where liquidity may be taken, where breakouts may develop, or where failed breakouts may occur.
The model does not project the HTF candle before the session opens. It activates when an enabled session opens. At that point, it takes the most recent fully confirmed HTF candle and uses it as the active session reference.
This creates a consistent question for the trader:
How is price reacting around the previous confirmed HTF candle during the current session?
What Makes This Script Original
This script is not designed as a simple combination of unrelated indicators. The components are connected through one session-based model:
1. Session engine
The script allows users to enable Asia, London, and New York sessions. Each session can use its own time window and timezone setting.
2. HTF reference map
At the start of an enabled session, the script maps the previous confirmed HTF candle. This includes the HTF high, low, midpoint, optional candle body, and optional session open level.
3. Sweep model
The script checks whether price sweeps above the HTF high or below the HTF low. Users can choose between a basic wick sweep or a stricter sweep that requires price to close back inside the HTF range.
4. Delivery shift confirmation
After a sweep occurs, the script can wait for a delivery shift confirmation before marking a sweep entry. A bearish confirmation requires price to break below a recent low range after a high sweep. A bullish confirmation requires price to break above a recent high range after a low sweep.
5. Breakout model
If price closes and holds outside the HTF range, the script can classify the move as a breakout. Users can set how many bars price must hold beyond the range.
6. Displacement filter
The breakout model can optionally require stronger candle movement by comparing the candle body against ATR. This helps filter weaker breaks that do not show meaningful displacement.
7. Failed breakout trap model
If price breaks beyond the HTF high or low and then returns back inside the range, the script can classify that move as a failed breakout trap. A Bull Trap means price broke above the HTF high and failed back inside. A Bear Trap means price broke below the HTF low and failed back inside.
These parts work together because they all answer the same question: did price sweep the HTF range, accept beyond it, or fail after breaking it?
How The Script Calculates The Model
When a new enabled session begins, the script requests the previous confirmed candle from the selected higher timeframe. The selected HTF may be adjusted by the user, such as 1H, 2H, 4H, Daily, or Weekly.
The script then stores the following values:
* Previous HTF open
* Previous HTF high
* Previous HTF low
* Previous HTF close
* Previous HTF midpoint
* Current session open
These values become the session reference map.
During the active session, the script checks price against the HTF high and low.
High Sweep:
A high sweep is detected when price trades above the previous HTF high.
Low Sweep:
A low sweep is detected when price trades below the previous HTF low.
Close Back Inside Sweep Mode:
When this stricter mode is selected, a high sweep requires price to close back below the HTF high. A low sweep requires price to close back above the HTF low.
Sweep Entry:
A sweep entry is not triggered by the sweep alone. After a sweep, the script waits for a delivery shift confirmation using the selected lookback length.
Breakout Long:
A breakout long is detected when price closes above the HTF high and holds above it for the selected number of bars.
Breakout Short:
A breakout short is detected when price closes below the HTF low and holds below it for the selected number of bars.
Bull Trap:
A bull trap is detected when price breaks above the HTF high but later closes back below the HTF high.
Bear Trap:
A bear trap is detected when price breaks below the HTF low but later closes back above the HTF low.
Volume Filter:
The optional volume filter compares current volume against a moving average of volume multiplied by the selected volume multiplier. When enabled, sweep and breakout conditions must also pass the volume filter.
Bar Close Confirmation:
The script includes an option to confirm signals only after the bar closes. This is enabled by default to make signals more stable for alerts and historical review.
How To Use This Script
1. Choose the reference timeframe
Select the HTF candle you want to use as the session reference. Intraday traders may use 1H, 2H, or 4H. Higher-timeframe traders may prefer Daily or Weekly.
2. Enable the sessions you trade
The script supports Asia, London, and New York sessions. Users can enable or disable each session and adjust the session window and timezone.
3. Watch the HTF range during the session
Once the session opens, the script draws the previous confirmed HTF candle range. The high and low are the main reaction levels.
4. Read price behaviour around the range
If price sweeps a level and returns inside, it may indicate a liquidity sweep.
If price closes and holds outside the range, it may indicate breakout continuation.
If price breaks outside and then returns inside, it may indicate a failed breakout trap.
5. Use the labels as classifications, not automatic trade commands
The labels are designed to classify price behaviour. They are not guaranteed buy or sell signals.
6. Combine with your own confirmation
Users should combine this model with their own market context, risk management, higher-timeframe bias, and execution plan.
Main Visual Elements
HTF Range Box:
Shows the previous confirmed HTF candle range during the active session.
HTF Candle Display:
Optionally displays the previous HTF candle body and wick on the chart.
High and Low Lines:
Marks the previous HTF high and low.
Midpoint Line:
Marks the midpoint of the HTF range.
Session Open Line:
Marks the price at the open of the active session.
Sweep Marks:
Marks when price sweeps above or below the HTF range.
Sweep Entry Marks:
Marks when a sweep is followed by delivery shift confirmation.
Breakout Marks:
Marks when price closes and holds outside the HTF range.
Trap Marks:
Marks failed breakout conditions as Bull Trap or Bear Trap.
Dashboard:
Optional compact dashboard showing the current session, HTF reference, confirmation mode, state, high, low, and midpoint.
Important Settings
Reference HTF Candle:
Controls which higher timeframe is used for the previous confirmed candle reference.
Sweep Mode:
Choose between Wick Sweep or Wick Sweep + Close Back Inside.
Confirm Signals On Bar Close:
When enabled, signals confirm after candle close. This is recommended for cleaner historical review and alerts.
Delivery Shift Lookback:
Controls how many bars are used to confirm a shift after a sweep.
Breakout Hold Bars:
Controls how many bars price must remain outside the HTF range before a breakout is confirmed.
Displacement Filter:
Requires the candle body to be large enough compared with ATR before confirming a breakout.
Volume Filter:
Optional filter requiring current volume to exceed average volume by the selected multiplier.
Keep Historical Sessions:
When disabled, the chart stays cleaner by only showing the current/latest session map. When enabled, historical session maps can remain visible, with a limit to reduce chart clutter.
Visual Modes:
Clean mode is designed for normal use.
Stealth mode reduces visual intensity.
Debug mode makes internal reference levels easier to inspect.
Alerts
The script includes alert conditions for:
* HTF high swept
* HTF low swept
* Sweep short
* Sweep long
* Breakout long
* Breakout short
* Bull trap
* Bear trap
* Master alert for any model event
The master alert is included so users can create one alert condition instead of setting up many separate alerts.
Recommended Use
This script is best suited for traders who use session timing, higher-timeframe ranges, liquidity sweeps, breakout continuation, and failed breakout concepts.
It may be useful on intraday charts where Asia, London, and New York session behaviour matters. It can also be adjusted for different markets and timeframes by changing the reference HTF and session settings.
Limitations
This script does not predict future price movement. It classifies how price behaves around the previous confirmed HTF candle during active sessions.
A sweep does not guarantee a reversal.
A breakout does not guarantee continuation.
A trap does not guarantee a full trend change.
Volume data may behave differently depending on the market and symbol.
Session behaviour can vary across forex, crypto, futures, indices, and stocks.
This tool should be used as a market structure framework, not as a standalone trading system.
Originality And Usefulness Statement
The originality of this script is in how it combines session timing, previous confirmed HTF candle mapping, sweep classification, breakout confirmation, and failed breakout detection into one connected workflow.
The script is useful because it gives traders a structured way to observe whether price is taking liquidity, accepting outside a higher-timeframe range, or failing after a breakout attempt. Each component supports the same central model rather than acting as an unrelated indicator mashup.
Disclaimer
This indicator is for educational and analytical use only. It is not financial advice and does not guarantee trading results. Users are responsible for their own trading decisions, testing, and risk management.
指標

指標

Adaptive Stochastic with Colored Lines and ZonesAdaptive Stochastic with Colored Lines and Zones
"Adaptive Stochastic with Colored Lines and Zones" is an enhanced Stochastic Oscillator designed to improve trend visualization and market momentum analysis through dynamic color changes and clearly defined overbought/oversold zones.
The indicator automatically adjusts the color of the main Stochastic line according to prevailing market conditions:
**Blue** indicates bullish momentum and strengthening upward pressure.
**Red** indicates bearish momentum and increasing downward pressure.
This visual feedback helps traders quickly assess market direction without adding additional trend-following tools to the chart.
Overbought and Oversold Zones
The indicator highlights key momentum extremes:
* **Above 80** – Strong Overbought Zone
* **Below 20** – Strong Oversold Zone
These areas can help identify periods of extended market movement, potential pullbacks, or possible reversal conditions when combined with price action and other forms of technical analysis.
Applications
* Trend identification
* Momentum analysis
* Confirmation of market direction
* Detection of overbought and oversold conditions
* Support for entry and exit timing
Suitable Markets
The indicator can be used across multiple asset classes, including Forex, Cryptocurrencies, Stocks, Indices, and Futures, and is compatible with various trading styles ranging from intraday trading to longer-term trend analysis.
Notes
As with any technical indicator, Adaptive Stochastic with Colored Lines and Zones should be used as part of a broader trading strategy and not as a standalone signal generator. Combining momentum readings with market structure, support and resistance levels, and risk management techniques may improve decision-making.
指標

Wyckoff Accumulation HunterSurfaces potential accumulation setups in deep-drawdown names where demand may be absorbing supply — built around classic Wyckoff structure (selling climax, spring, accumulation range) with a scored, rules-based filter.
How eligibility works
A name becomes eligible only when it's at least 30% off its 2-year high and meets a liquidity floor. Eligible names are then scored 0–10 across eight conditions: drawdown depth, position relative to the 21 and 55 EMAs, selling-climax recency, range compression, volume dry-up, StochRSI reset, and proximity to the structural demand floor.
How an entry prints
An entry marker appears only when the score clears the threshold you set AND structure confirms — either a spring (an undercut-and-reclaim of the structural low) or a retracement into the 0.618–0.786 zone at EMA confluence. A base-maturity check prevents firing during waterfalls (it requires the broken low to have actually held), and signals confirm on bar close.
Conviction tagging
A filled green triangle marks a spring at the demand floor (highest conviction — invalidation sits right at the floor). A hollow gray triangle marks a spring up in the range, with the floor still open below.
On-chart structure
Three liquidity bands map the markdown: green demand, gray range, red supply. A fibonacci ladder (0.236 → 1.272) projects from the base low as a reference for managing a position, and a red line marks the invalidation level at the spring low — volume-gated, so a low-volume test poke doesn't count, only a genuine high-volume break.
Inputs
Adjustable threshold (set your own conviction level), lookback lengths (scale to any timeframe), and all display toggles.
Notes
Works on any timeframe once lookbacks are scaled; designed and tuned on the weekly. Repaint-free — all signals confirm on close, no lookahead. This is a discretionary analysis tool to surface setups for your own research. It is not a recommendation or financial advice, and prior structure does not guarantee future behavior. 指標

Smart Risk ManagerSmart Risk Manager is a visual risk-planning and position-sizing indicator designed to help traders build a structured trade plan directly on the chart.
The script calculates and displays:
* Account risk
* Risk amount
* Planned entry
* Stop level
* Stop distance
* Position size
* Position value
* Exposure percentage
* Risk:Reward
* Up to three target zones
* Target confluence sources
* Auto BOS setup status
* Manual trade plan status
* Entry / Stop / Target lines
* A customizable risk dashboard
This is an indicator, not a strategy. It does not place orders, does not execute trades, and does not produce TradingView Strategy Tester backtest results. The tool is intended for trade planning, educational risk management, and chart-based analysis only.
Important note
Smart Risk Manager does not guarantee profitable trades.
It does not predict future price movement.
It does not provide financial advice.
It does not replace a broker, a trading plan, or professional risk management.
All values are calculated from the user’s selected inputs and the chart’s price data. Users should always verify position size, tick value, contract multiplier, margin requirements, spread, commission, slippage, and broker-specific rules before using any calculated value in live trading.
Main purpose
The purpose of Smart Risk Manager is to help traders answer practical planning questions before entering a trade, such as:
* Where is the planned entry?
* Where is the stop?
* How much money is at risk?
* What position size matches the selected risk percentage?
* What is the approximate exposure?
* Where are possible targets?
* Which target levels have confluence?
* What is the approximate Risk:Reward profile?
The indicator is designed to make risk planning more visible and easier to review on the chart.
1. Account & Risk
The Account & Risk section allows the user to define the basic risk model.
Account Size
The user enters the total account size in the account currency.
Risk per Trade %
The user selects the maximum percentage of the account to risk if the stop level is reached.
For example, if Account Size is 10,000 and Risk per Trade is 1%, the planned risk amount is 100.
Instrument Type
The script includes instrument selection for:
* Stocks / Shares
* Forex / Units
* Crypto / Coins
This affects the display wording for the calculated position size.
Round size to whole units
When enabled, the calculated position size is rounded down to whole units. This is useful for stocks and shares.
When disabled, the script can display fractional sizing, which may be more suitable for crypto or some forex/CFD planning workflows.
Important limitation
The position-sizing calculation is generic. Some markets use contract multipliers, tick values, lot sizes, minimum order quantities, leverage, margin rules, spread costs, and currency conversions. Users must confirm the final order size with their broker or exchange.
2. Entry Logic Modes
The script includes two planning modes:
* Auto BOS
* Manual Plan
Auto BOS Mode
Auto BOS mode uses market structure to create a logical planning setup when price breaks a confirmed structure level.
The script detects confirmed pivot highs and pivot lows using the selected Structure Pivot Left and Structure Pivot Right settings.
A bullish Auto BOS setup can appear when price closes above the last confirmed structure high.
A bearish Auto BOS setup can appear when price closes below the last confirmed structure low.
The Auto BOS mode can be used to automatically create:
* Auto entry level
* Auto stop level
* Direction
* Setup reason
* Risk and target plan
Auto Direction
The user can choose:
Both
Allows both long and short Auto BOS planning setups.
Long Only
Allows only bullish Auto BOS planning setups.
Short Only
Allows only bearish Auto BOS planning setups.
Candle Confirmation
When enabled, the breakout candle must confirm direction:
* Long setup requires a bullish candle.
* Short setup requires a bearish candle.
Max Breakout Distance %
This filter helps avoid planning entries when price has already moved too far away from the broken structure level.
A value of 0 disables this filter.
Min Structure Range %
This filter helps avoid very small structures that may produce noisy or low-quality Auto BOS events.
Auto Stop Style
The script includes two Auto Stop styles:
Recent Pullback
Uses a recent pullback area for a closer stop.
Structure Swing
Uses the broader structure swing for a wider structural stop.
Auto Stop Buffer %
Adds a small buffer beyond the selected auto stop level.
Minimum R:R Filter
When enabled, Auto BOS setups appear only if the projected setup Risk:Reward is equal to or above the selected minimum value.
One active setup at a time
When enabled, the script prevents repeated same-direction Auto BOS setups until an opposite setup appears.
Show Auto BOS signals
This setting is OFF by default. When enabled, the script displays Auto Long BOS and Auto Short BOS markers on the chart.
Important note about Auto BOS
Auto BOS is a planning event based on confirmed structure. It is not an automatic buy or sell recommendation. It should be used as a planning reference and combined with the user’s own analysis.
3. Manual Plan Mode
Manual Plan mode allows the user to create a custom trade plan.
The user selects:
* Manual Direction
* Manual Entry Price
* Manual Stop Mode
* Target methods
Manual Direction
The user can choose:
Long
Creates a long-side plan.
Short
Creates a short-side plan.
Manual Entry Price
The user enters the planned entry price manually.
Manual Plan mode is useful when the trader already has a specific entry level and wants the script to calculate position size, risk, exposure, and target levels.
4. Stop Loss Methods
The script supports several stop calculation methods in Manual Plan mode.
Swing Structure
Uses the recent swing low for long plans or recent swing high for short plans.
ATR
Uses an ATR-based stop distance from the manual entry price.
For long plans, the stop is placed below entry.
For short plans, the stop is placed above entry.
Percent
Uses a percentage-based stop from the manual entry price.
Manual
Allows the user to enter a custom stop price.
Important stop placement rule
For a valid long plan, the stop must be below the entry.
For a valid short plan, the stop must be above the entry.
If the stop is placed incorrectly, the dashboard will show an invalid stop status.
5. Position Size Calculation
The script calculates position size from:
* Account Size
* Risk per Trade %
* Entry Price
* Stop Price
* Stop Distance
The general logic is:
Risk Amount = Account Size × Risk %
Position Size = Risk Amount ÷ Stop Distance
The script then displays:
* Risk Amount
* Stop Distance
* Position Size
* Position Value
* Exposure %
Risk Amount
The estimated amount that would be lost if the planned stop is reached, before considering real-world execution costs such as spread, slippage, commission, and broker rules.
Position Size
The calculated quantity based on the selected risk amount and stop distance.
Position Value
The approximate value of the planned position.
Exposure %
The position value compared with account size.
If exposure is above 100%, the dashboard highlights it as a potential leverage or overexposure condition.
6. Target Methods
The script can create target candidates from several sources.
The user can enable or disable each target method.
Available target methods:
* Swing Highs / Lows
* Fibonacci Extension
* Liquidity Equal Highs / Lows
* R-Multiple
* Manual prices
Swing Highs / Lows
For long plans, the script uses previous swing highs as potential target levels.
For short plans, it uses previous swing lows.
Fibonacci Extension
The script uses the selected swing lookback and Fibonacci extension levels to calculate possible target levels.
Default extension levels include:
* 127.2%
* 161.8%
* 261.8%
These levels can be changed in settings.
Liquidity Equal Highs / Lows
When enabled, the script looks for approximately equal highs or equal lows using the selected tolerance.
For long plans, equal highs can be used as possible upside liquidity targets.
For short plans, equal lows can be used as possible downside liquidity targets.
R-Multiple Targets
The script can calculate targets based on the risk distance.
Default R-Multiple targets include:
* 1R
* 2R
* 3R
Manual Targets
The user can enter up to three custom target prices manually.
7. Target Confluence
The script groups target candidates that are close to each other.
Confluence tolerance controls how close target levels must be to be grouped together.
If multiple target methods point to approximately the same area, the script marks the target as a confluence zone.
Examples of target confluence:
* Swing + Fibonacci
* R-Multiple + Fibonacci
* Liquidity + Swing
* Manual + R-Multiple
Targets with stronger confluence are visually highlighted differently from single-method targets.
Important note about targets
Targets are planning references only. They do not guarantee that price will reach them. They should be used as possible reference zones, not as guaranteed outcomes.
8. Dashboard
Smart Risk Manager includes a customizable dashboard.
The dashboard displays:
Account
The account size entered by the user.
Risk %
The selected percentage of account risk.
Risk Amount
The estimated risk amount based on position size and stop distance.
Entry
The planned entry price.
Stop
The planned stop price.
Stop Distance
The distance between entry and stop, displayed in price units and percentage.
Position Size
The calculated quantity for the selected risk.
Position Value
The approximate value of the planned position.
Exposure
The position value as a percentage of account size.
Risk : Reward
The approximate Risk:Reward to the furthest selected target.
Setup Logic
Shows whether the plan is based on Auto BOS or Manual Plan.
Reason
Shows the current reason or status of the setup.
Targets From
Shows which target methods are enabled.
T1 / T2 / T3
Shows up to three calculated target levels.
Status
Shows the current planning status, such as:
* Waiting for BOS setup
* Set manual entry price
* Invalid stop placement
* No targets - enable method
* Leverage > 100%
* High risk per trade
* OK to plan
9. Dashboard Themes
The script includes several dashboard themes:
* Luxury Dark
* Midnight Blue
* Graphite Gold
* Classic Dark
The user can also choose:
* Dashboard position
* Dashboard size
* Alternate row shading
10. Entry / Stop / Target Lines
When enabled, the script draws visual lines on the chart:
Entry Line
Shows the planned entry level.
Stop Line
Shows the planned stop level.
Target Lines
Shows up to three target levels.
Target labels can include:
* Target price
* R-Multiple
* Estimated potential gain
* Target source method
* Confluence marker when multiple methods align
Line Length
Controls how far the planning lines extend to the right.
11. Alerts
The script includes alert conditions for:
Auto Long BOS
Triggered when a bullish Auto BOS planning setup is detected.
Auto Short BOS
Triggered when a bearish Auto BOS planning setup is detected.
STOP hit
Triggered when price reaches the displayed stop level.
Target 1 reached
Triggered when price reaches Target 1.
Target 2 reached
Triggered when price reaches Target 2.
Target 3 reached
Triggered when price reaches Target 3.
Important alert note
Alerts are notifications only. They do not place orders and do not confirm broker execution.
12. How to use Smart Risk Manager
A practical workflow:
1. Enter your account size.
2. Select your risk per trade.
3. Choose the instrument type.
4. Choose Auto BOS or Manual Plan.
5. If using Manual Plan, enter the planned entry price.
6. Choose a stop method or enter a manual stop price.
7. Enable the target methods you want to use.
8. Review position size, risk amount, exposure, and Risk:Reward in the dashboard.
9. Review Entry / Stop / Target lines on the chart.
10. Confirm all values with your broker before placing any real trade.
Suggested use cases
Smart Risk Manager can be useful for:
* Position sizing
* Pre-trade planning
* Risk review
* Stop distance review
* Exposure control
* Target planning
* Risk:Reward comparison
* Auto BOS setup planning
* Manual trade planning
* Educational risk-management study
13. Important limitations
This script does not execute trades.
This script is not a trading strategy.
This script does not provide Strategy Tester results.
This script does not guarantee profitable outcomes.
This script does not account for all broker-specific rules.
The calculated position size is a generic estimate.
Forex, futures, CFDs, and leveraged products may require contract-size, tick-value, pip-value, margin, and currency conversion adjustments.
Commissions, spreads, slippage, taxes, borrow fees, funding costs, and order execution differences are not included in the generic calculation.
Auto BOS setups are structure-based planning events, not automatic trade recommendations.
Pivot-based structure requires confirmation bars, so structure levels are confirmed after the selected pivot settings.
Target levels are possible planning references, not guaranteed price destinations.
Stop and target alerts are chart-level events, not broker fills.
Users are responsible for verifying all calculations and managing their own risk.
14. Originality and purpose
Smart Risk Manager combines several trade-planning tools into one organized dashboard:
* Account risk calculation
* Position size calculation
* Auto BOS planning mode
* Manual trade planning mode
* Multiple stop methods
* Multiple target methods
* Target confluence grouping
* Exposure monitoring
* Visual Entry / Stop / Target lines
* Customizable dashboard themes
* Alert conditions for planning levels
The purpose of the script is to help traders build a clearer and more structured risk plan before making a trading decision.
Educational disclaimer
Smart Risk Manager is for educational and chart-analysis purposes only. It is not financial advice, investment advice, or a recommendation to buy or sell any financial instrument. Users should perform their own analysis and confirm all position-sizing and risk calculations with their broker or exchange before trading.
指標

FVG Sigma [Smart Money]A Fair Value Gap is a 3-candle imbalance: the middle candle runs hard and leaves a void between candle 1 and candle 3. The problem with marking them is that gaps come in every size — most tools draw every single one, and the chart fills with noise where trivial micro-gaps sit next to the ones that actually mattered. FVG Sigma measures each gap's width and keeps only the statistically unusual ones.
HOW IT WORKS
Every gap's geometric width is fed into a rolling sample pool, with separate pools for bullish and bearish gaps. A new gap is z-scored against its own pool *before* it is added (no look-ahead into its own sample):
`z = (gap width − mean) / standard deviation`
Only gaps with `z >= threshold` (e.g. 2 sigma) are drawn — "unusually large for this symbol on this timeframe." Because a z-score is scale-free (the mean and the standard deviation share the gap's own units), there is no ATR or point normalization to tune; sigma absorbs symbol and timeframe scale on its own. The pool still collects *every* gap, so the baseline stays honest — but only the outliers reach the chart. Until a pool has gathered Min Samples gaps, nothing is drawn (warm-up).
Each surviving gap is then tracked for mitigation. The zone splits into a vivid *fresh* band and a faded *consumed* band at the deepest penetration so far (a high-water mark that never retreats), and an in-zone label reports consumption as a live percentage. When the consumed front reaches the far edge, the gap is fully mitigated and removed (or kept faded, your choice).
1) A confirmed 3-candle gap is measured and z-scored against its side's pool
2) If `z >= threshold`, the zone is drawn; otherwise it is only added to the pool
3) Price penetration splits the zone fresh/consumed and updates the live percentage
HOW TO READ
- A vivid band is the fresh, un-touched portion of a significant gap.
- The faded band behind it is the part price has already traded through.
- The in-zone label is the live consumed percentage (how much of the gap is gone).
- "Significant" means statistically large — an unusual imbalance, not a buy or sell instruction. A large gap is just a large gap; it does not predict fill, reversal, or direction. The tool marks the area; the read is yours.
INPUTS
- Sample Size N — how many recent gap widths each side's pool holds.
- Z-Score Threshold (sigma) — how extreme a gap must be to be drawn. Higher = fewer, stronger gaps.
- Min Samples — warm-up; filtering starts only once the pool has this many gaps.
- Mitigation — Wick (penetration tracked by bar high/low, live but exact) or Close (only confirmed closes count).
- Remove Mitigated / Avoid Overlap — drop fully-consumed zones; skip a new gap that overlaps a same-side one.
- Bullish FVG / Bearish FVG — enable each side independently.
- Show Last Bullish / Bearish — per-side display caps.
- Extend Right / Show Consumed % — projection length; toggle the live label.
- Style — bullish/bearish fills and text colours, fresh and mitigated transparency.
ALERTS
Two separate conditions: New significant Bullish FVG and New significant Bearish FVG. Both fire on closed bars — use "Once Per Bar Close."
NOTES & LIMITS
This is a statistical observation, not a forecast: the filter flags gaps that are unusually large for the current symbol and timeframe, nothing more. It does not say a gap will be filled, hold, or reverse. Scale-free by design — the z-score normalizes symbol and timeframe scale, so there is no ATR or point setting to calibrate. No repaint, no lookahead: gaps are created on confirmed (closed) bars only and their levels never move. Mitigation in Wick mode updates the consumed percentage live but stays exact, because a bar's high/low is a running extreme that is never revised; Close mode updates only on bar close. Open-source under CC BY-NC-SA 4.0 — non-commercial use, attribution to ElisTools required for reuse or derivatives. TradingView (Pine v6) only.
指標
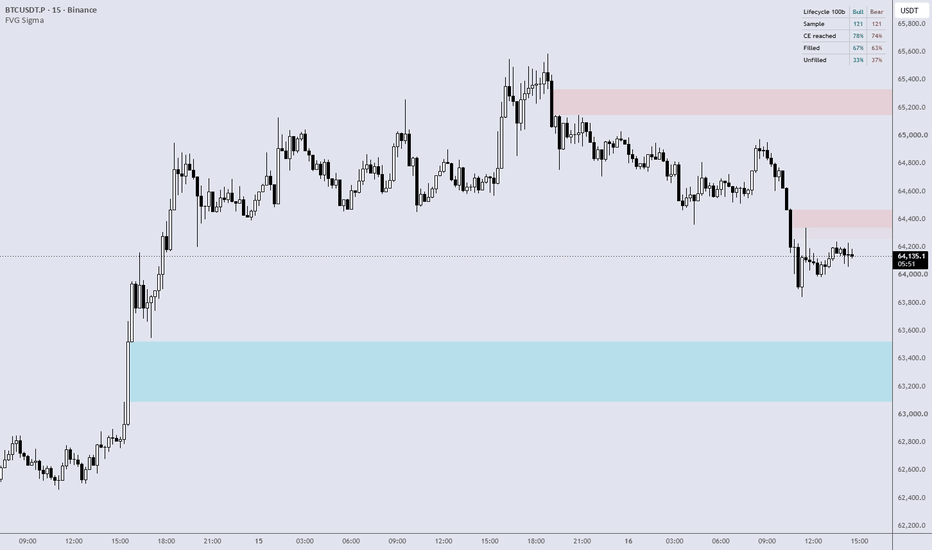
Effort vs Result [Wyckoff]Wyckoff's "effort vs result," quantified. Effort = volume (how much trading took place). Result = how far price actually travelled. When a bar shows heavy effort but little result, supply/demand is being absorbed — a battle worth marking.
HOW IT WORKS
Effort and result are turned into z-scores over a rolling window, so "high" and "low" mean high/low for this symbol on this timeframe — not a fixed number.
Absorption (high effort, low result) does not give direction — it only marks an important area where effort got absorbed. The indicator draws that area as a zone and waits. The zone develops, growing to include every following bar. The moment price closes beyond the developing range — either side, any volume — the level has given way. That break, in its own direction, is the signal.
1) Absorption seeds a zone (its high–low)
2) Each following bar expands the range
3) A close beyond the range = breakout (within N bars), otherwise the zone is discarded
HOW TO READ
- Grey dashed box: a developing absorption zone (directionless).
- Green triangle below a bar: bullish breakout (closed above the zone) — box turns green.
- Red triangle above a bar: bearish breakout (closed below the zone) — box turns red.
Zones that time out or get breached without a clean close disappear, so only meaningful areas remain.
INPUTS
- Z-Score Lookback — window for the rolling mean / standard deviation.
- Divergence Threshold (σ) — how extreme a bar must be to count as absorption. Higher = fewer, stronger zones.
- Result Source — Range (high−low), Body (|close−open|), or True Range (gap-aware).
- Detection Mode — Score (combined divergence, looser) or Strict (both legs extreme).
- Max Bars: Absorption → Breakout — how long a zone waits before being discarded.
- Visuals — show/hide zones, arrows, labels, colours.
ALERTS
Two separate conditions: Bullish Breakout and Bearish Breakout (use "Once Per Bar Close").
NOTES & LIMITS
Volume reliability depends on the symbol/feed — on spot FX it is tick volume, not real contracts; no volume = no signals. This is a statistical observation, not a forecast: a z-score flags an unusual bar, a breakout shows a level gave way — neither guarantees what price does next. No repaint, no lookahead: all calculations are on closed bars; z-scores use past bars only. 指標

指標

指標

指標

Previous Day Regular Session OHLC LevelsPrevious Day RTH OHLC Levels
This indicator displays the most recent completed regular trading session’s Open, High, Low, and Close levels on an intraday chart.
It was built for traders who keep extended-hours data visible but still want clean reference levels from the regular session only. For U.S. equities, the default regular session is set to 09:30 to 16:00, and the default after-hours session is set to 16:00 to 20:00.
What it shows
PDH: Previous regular-session high
PDL: Previous regular-session low
PDC: Previous regular-session close
PDO: Previous regular-session open
The indicator tracks the current regular session’s OHLC values during the day. When after-hours begins, it locks those values and displays them as the prior completed regular-session levels.
Why use it
These levels can be useful as reference points for intraday context, especially when viewing premarket or after-hours price action. They can help show whether price is trading above or below the prior regular-session range, open, or close.
Settings
Regular session: default 0930-1600
After-hours session: default 1600-2000
Show or hide solid OHLC lines
Show or hide right-side labels
Adjust label offset, label size, and line width
Important notes
This is not a buy or sell signal. It does not predict direction. It simply plots prior regular-session OHLC reference levels.
For best results, use it on intraday charts with extended-hours data enabled. It is designed around U.S. equity market hours. 指標

Price Action Structure
Price Action Structure is an open price-action toolkit designed to help traders read market structure, structural breaks, order block context, premium/discount zones, previous daily and weekly levels, qualified setup conditions, and optional Fair Value Gaps.
This is an indicator, not a strategy. It does not place trades, does not execute orders, and does not produce Strategy Tester results. The tool is designed for chart analysis, market-structure study, and visual context only.
Main modules
1. Market Structure
The indicator identifies both Internal Structure and Swing Structure.
Internal Structure
Internal Structure uses a shorter pivot length and is designed to show faster short-term structure changes. It can mark:
* Internal BOS
* Internal CHoCH
* Internal CHoCH+
Swing Structure
Swing Structure uses a longer pivot length and is designed to show higher-level market structure. It can mark:
* Swing BOS
* Swing CHoCH
* Swing CHoCH+
Label meaning
BOS means Break of Structure.
A bullish BOS appears when price closes above a confirmed structural high.
A bearish BOS appears when price closes below a confirmed structural low.
CHoCH means Change of Character.
A bullish CHoCH appears when price breaks upward after the previous structure was bearish.
A bearish CHoCH appears when price breaks downward after the previous structure was bullish.
CHoCH+ is a stronger change-of-character label. It appears when the change of character is supported by a stronger structural condition, such as a higher low for bullish context or a lower high for bearish context.
Internal BOS / CHoCH
These labels represent fast structure changes and are useful for short-term market reading.
Swing BOS / CHoCH
These labels represent higher-level structure and are generally more important for broader trend context.
Structure label text
The script includes two label text modes:
Full
Shows labels such as Internal BOS, Swing BOS, Internal CHoCH, and Swing CHoCH.
Short
Shows compact labels such as BOS, S-BOS, CHoCH, and S-CHoCH.
Important note about pivots
Market structure is based on confirmed pivots. Pivots require a selected number of bars to the left and right before they are confirmed. This means structure labels appear only after the pivot has been confirmed. Once a structure break is confirmed on bar close, the break label does not repaint after confirmation.
2. Volumetric Order Blocks
The indicator includes optional bullish and bearish order blocks.
Order Blocks are OFF by default.
Bullish Order Block
A bullish order block can be created after an internal bullish structure break.
The script scans the impulse leg and looks for the relevant candle zone that may represent demand context.
Bearish Order Block
A bearish order block can be created after an internal bearish structure break.
The script scans the impulse leg and looks for the relevant candle zone that may represent supply context.
Order Block visual design
Each order block can include:
* Main zone box
* Split buy/sell profile inside the zone
* Optional dashed mid-line
* Optional volume metrics label
The split-profile visual design is intended to give a quick view of how the bar’s volume was distributed inside the order block area.
Important note about volume split
The buy/sell split is an approximation. Pine Script does not provide historical tick-level buy/sell volume split. The script estimates the split from each candle’s close location inside its range and weights it by volume.
This should be understood as a visual approximation, not true bid/ask delta or true order-flow data.
Order Block mitigation
The script supports two mitigation methods:
Close
The order block is removed when price closes beyond the far edge of the zone.
Wick
The order block is removed when any wick moves beyond the far edge of the zone.
Hide Overlap
When enabled, the script avoids drawing overlapping order blocks on the same side. This is useful for keeping the chart clean.
Show Last
Controls how many active bullish and bearish order blocks remain visible on the chart.
Profile Width Bars
Controls the fixed width of the internal buy/sell profile inside the order block. The profile does not stretch with the full order block extension.
OB Body Transparency
Controls the background transparency of order block zones. Higher values make the order block background lighter.
3. Premium / Discount / Equilibrium Zones
The indicator includes optional Premium, Discount, and Equilibrium zones.
Premium / Discount Zones are OFF by default.
These zones are based on the active swing range.
Premium
The upper area of the current swing range.
Premium can help users identify where price is relatively high inside the selected swing range.
Discount
The lower area of the current swing range.
Discount can help users identify where price is relatively low inside the selected swing range.
Equilibrium
The middle area of the current swing range.
Equilibrium represents the middle reference area between the premium and discount zones.
Edge Zone Width
Controls the thickness of the Premium and Discount zones.
Equilibrium Half Width
Controls the width of the Equilibrium band around the midpoint.
Important note
Premium / Discount / Equilibrium zones are context tools only. They do not predict reversal or continuation by themselves.
4. Previous Day and Previous Week Levels
The indicator can display previous daily and weekly high/low levels.
These levels are OFF by default.
Previous Day High / Low
When enabled, the script plots:
* PDH: Previous Day High
* PDL: Previous Day Low
Previous Week High / Low
When enabled, the script plots:
* PWH: Previous Week High
* PWL: Previous Week Low
These levels are useful for identifying prior session liquidity areas, important reference levels, and possible reaction zones.
Daily levels are intended mainly for intraday charts.
Weekly levels are intended mainly for charts below the weekly timeframe.
5. Qualified Buy / Sell Setups
The indicator includes optional qualified BUY SETUP and SELL SETUP labels.
Buy/Sell Setups are OFF by default.
These are not automatic trade recommendations. They are conditional price-action setup labels based on the script’s structure and order block logic.
BUY SETUP logic
A BUY SETUP can appear when:
* price touches a bullish order block,
* the setup remains valid within the selected setup window,
* internal bullish BOS confirms after the touch,
* optional swing bias and premium/discount filters pass depending on selected setup quality.
SELL SETUP logic
A SELL SETUP can appear when:
* price touches a bearish order block,
* the setup remains valid within the selected setup window,
* internal bearish BOS confirms after the touch,
* optional swing bias and premium/discount filters pass depending on selected setup quality.
Setup Quality
The script includes three setup quality modes:
Strict
Strict mode requires more confirmation. It produces fewer setups but with more filtering.
Balanced
Balanced mode is the recommended middle setting. It allows setups when either the broader swing bias or premium/discount context supports the setup.
Aggressive
Aggressive mode requires less filtering. It produces more setups but can create more false or lower-quality events.
Setup Validity Bars
Controls how many bars are allowed between the order block touch and the internal BOS confirmation.
Signal Size
Controls the size of BUY SETUP and SELL SETUP labels.
Signal Distance From Candle
Uses ATR to place setup labels away from candles for better chart readability.
Important note about setup labels
BUY SETUP and SELL SETUP labels are not guaranteed buy or sell signals. They are visual setup conditions that should be confirmed with the user’s own analysis, market context, and risk management.
6. Fair Value Gap
The indicator includes optional Fair Value Gaps.
FVG is OFF by default.
Fair Value Gap definition
A Fair Value Gap is a 3-candle imbalance zone.
Bullish FVG
A bullish FVG forms when the current low is above the high from two bars back.
Bearish FVG
A bearish FVG forms when the current high is below the low from two bars back.
FVG Timeframe
The script can calculate FVGs from:
* the current chart timeframe,
* tick-based timeframes,
* second-based timeframes,
* minute-based timeframes,
* hourly timeframes,
* daily timeframes,
* weekly timeframe,
* monthly and multi-month timeframes.
Availability of tick and second timeframes depends on the symbol and the TradingView plan.
FVG Mitigation Method
The script supports four mitigation methods:
Close
A bullish FVG is mitigated when price closes through its far side. A bearish FVG is mitigated when price closes through its far side.
Wick
A bullish FVG is mitigated when a wick reaches through its far side. A bearish FVG is mitigated when a wick reaches through its far side.
Average
The FVG is mitigated when price reaches the midpoint of the imbalance.
None
The FVG remains visible until removed by the Show Last FVGs limit.
Extend Imbalance
Controls how many bars the FVG box extends to the right.
Volatility Threshold
Filters FVGs by size using ATR.
A value of 0 disables the filter.
For example, 0.25 means the FVG must be at least 0.25 ATR in size.
Show Last FVGs
Controls how many bullish and bearish FVGs remain visible on the chart.
Hide Overlap
When enabled, the script skips new overlapping FVGs on the same side to reduce chart clutter.
Show FVG Label
When enabled, the script displays Bull FVG or Bear FVG text inside the gap.
FVG Transparency
Controls how light or strong the FVG background appears.
7. Quick Guide Section
The indicator includes a Quick Guide group inside settings.
This section contains tooltip explanations for:
* Structure label meaning
* Setup logic meaning
* Fair Value Gap meaning
The goal is to make the indicator easier to understand directly from the settings panel.
8. Alerts
The script includes alert conditions for important structure and setup events.
Market Structure Alerts
* Internal Bullish BOS
* Internal Bullish CHoCH
* Internal Bearish BOS
* Internal Bearish CHoCH
* Swing Bullish BOS
* Swing Bullish CHoCH
* Swing Bearish BOS
* Swing Bearish CHoCH
Order Block Alerts
* Bullish OB Touched
* Bearish OB Touched
Qualified Setup Alerts
* Qualified Buy Setup
* Qualified Sell Setup
Fair Value Gap Alerts
* New Bullish FVG
* New Bearish FVG
Alerts are notifications only. They do not execute trades and should not be treated as financial advice.
How to use the indicator
A practical workflow:
1. Start with Swing Structure to understand the higher-level market direction.
2. Use Internal Structure to monitor faster short-term shifts.
3. Enable Order Blocks if you want supply/demand context.
4. Use Premium / Discount / Equilibrium zones to understand where price is trading inside the active swing range.
5. Enable Previous Day / Week levels if you want session and higher-timeframe reference levels.
6. Enable Fair Value Gaps if you want to study imbalance zones.
7. Enable Qualified Buy/Sell Setups only if you want the script to mark conditional setup labels.
8. Use alerts to monitor selected structure, order block, setup, or FVG events.
9. Combine all signals with your own market context, risk management, and confirmation process.
Recommended visual setup for a clean chart
For a clean default chart:
* Keep Order Blocks OFF unless you need them.
* Keep Buy/Sell Setups OFF unless you are studying setup confirmation.
* Keep FVG OFF unless you are specifically analyzing imbalance zones.
* Use Swing Structure for higher-level context.
* Use Internal Structure for short-term structure.
* Enable Daily / Weekly Levels only when relevant to your timeframe.
* Enable Premium / Discount only when studying the active swing range.
Limitations
This indicator does not predict future price movement.
It does not guarantee profitable trades.
It is not a trading strategy.
It does not place orders.
It does not provide broker execution.
It does not provide true historical bid/ask delta.
The buy/sell volume split inside order blocks is an approximation based on candle close position and volume.
Pivots confirm only after the selected number of bars.
Fair Value Gaps are 3-candle imbalance zones and do not guarantee continuation or reversal.
Buy/Sell Setup labels are conditional setup markers, not automatic trading instructions.
Previous Day and Previous Week levels are reference levels only.
Different markets, symbols, timeframes, and sessions can behave differently.
Users are responsible for their own trade decisions, risk management, and position sizing.
Originality and purpose
Price Action Structure combines multiple price-action tools into one organized workflow:
* internal and swing market structure,
* BOS / CHoCH / CHoCH+ labels,
* optional volumetric order blocks,
* approximated buy/sell split profile inside order blocks,
* premium, discount, and equilibrium zones,
* previous day and previous week levels,
* qualified buy/sell setup logic,
* optional Fair Value Gaps,
* multi-timeframe FVG selection,
* FVG mitigation options,
* alert conditions for key events.
The purpose of the indicator is to provide a clean and customizable price-action map that helps traders study market structure, imbalance, order block context, and setup confirmation in one place.
Educational disclaimer
This script is for educational and chart-analysis purposes only. It is not financial advice, investment advice, or a recommendation to buy or sell any financial instrument. Users should perform their own analysis and manage risk independently.
指標

Range Fuel GaugeRANGE FUEL GAUGE — HOW MUCH OF TODAY'S RANGE IS LEFT, AS EXACT PRICES
Every instrument has a typical daily range. Once today's session has consumed most of it, breakout odds statistically fade and mean-reversion setups gain relevance. This indicator turns that idea into two things you can actually trade with: a live fuel gauge and two concrete price levels.
WHAT IT SHOWS
- Fuel panel — how much of the typical daily range today has already used (e.g. "79% used"), with a 10-segment bar that shifts green → amber → red, plus today's range, the typical range, and the points still left
- Upper room level — day low + typical range: the statistical ceiling for today if this session behaves like a typical recent session
- Lower room level — day high − typical range: the statistical floor on the same basis
- A side's room level automatically hides once that side of the range is fully consumed
HOW IT WORKS
1. The indicator stores the high-low range of the last N completed sessions (default 20)
2. Typical range = the Nth percentile of those ranges (default P80, adjustable 50-95)
3. Fuel used = today's developing range ÷ typical range
4. Room levels are simple arithmetic from today's day high / day low and the typical range — they tighten as the day's range expands
HOW TRADERS USE IT
- Fuel below 60% (green) — the day still has energy; breakout and continuation trades have statistical room
- Fuel 60-90% (amber) — range maturing; trail tighter, be selective with fresh breakouts
- Fuel above 90% (red) — the typical range is nearly spent; chasing moves is statistically poor, fade setups toward the day's value become relevant
- Room levels act as realistic intraday targets — for example, a long taken mid-session can use the upper room price as a statistically grounded objective
NOTES
- The room levels are statistical references built from this symbol's own recent history — they are not a forecast, and price can and does exceed them on trend days
- Historical ranges come only from completed sessions and never change after the fact; today's reading updates live as the session develops (by design)
- Alert included: fires when today's range crosses 100% of the typical range
- Panel position is selectable (8 positions); prices are shown as integers
- Works on any symbol; designed for intraday timeframes
This is an original implementation in Pine Script v6. The percentile logic and level arithmetic are fully described above.
Educational tool for market context — not financial advice. 指標
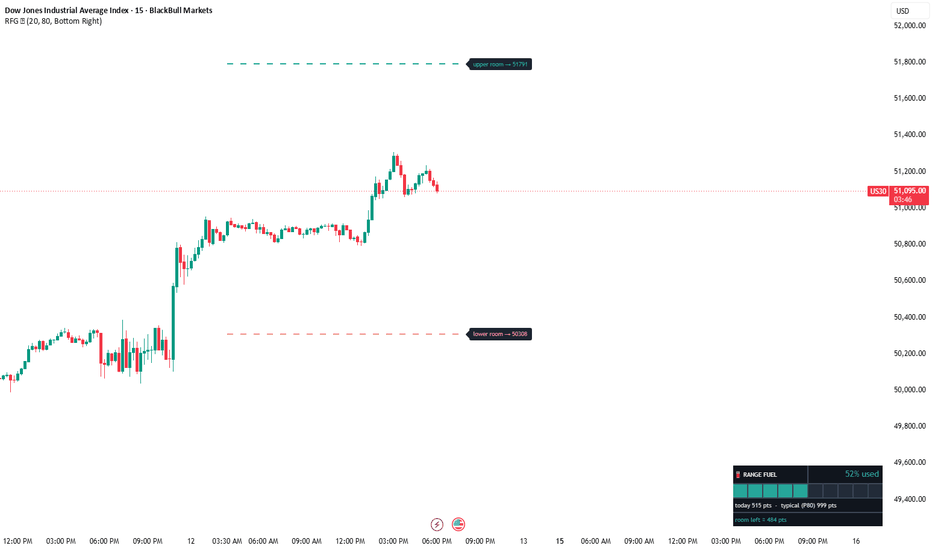
Fair Value Gaps + Inversion FVG [Quantum Algo]Fair Value Gaps + Inversion FVG
█ OVERVIEW
Most FVG indicators stop at drawing boxes. This one tracks the complete lifecycle of every gap — fresh → midline-tested → filled → INVERTED → retested — and automates the part of the model that traders actually trade: the Inversion Fair Value Gap (IFVG).
A Fair Value Gap is a 3-candle imbalance left behind when price moves too fast for two-sided trade to occur. Price frequently returns to these zones. But when price closes through a gap instead of respecting it, the zone does not die — it flips polarity. A violated bullish gap becomes resistance; a violated bearish gap becomes support. The first retest of that inverted zone is one of the cleanest entry models in the Smart Money Concepts framework, and this script detects, restyles, and signals it automatically.
█ FEATURES
Gap detection
— Bullish and bearish FVGs detected on confirmed bars only (non-repainting).
— ATR minimum-size filter removes insignificant micro-gaps.
— Optional displacement filter: the middle candle must be a genuine expansion bar (range greater than a configurable multiple of ATR), keeping only gaps created by aggressive participation.
Volume strength score
Every gap is stamped with a 0–100 score comparing the displacement candle's volume against its 20-bar average. A 90% gap and a 20% gap are not the same zone — now you can see the difference at a glance.
Consequent Encroachment (CE)
Each gap carries its 50% midline. The first touch of the CE is detected, the gap is visually dimmed to separate tested zones from fresh ones, and an alert is available.
Inversion engine (IFVG)
— A close through the gap converts it into an inverted zone with distinct styling.
— The first retest of an inverted zone prints an on-chart signal (long model for inverted bearish gaps, short model for inverted bullish gaps).
— A close back through the far side invalidates and removes the zone.
— Inversion can be disabled, in which case gaps simply fill and are removed or frozen (wick-fill or close-fill modes).
Multi-timeframe mode
Display gaps from one higher timeframe directly on your chart as dashed boxes. HTF gaps are built exclusively from closed higher-timeframe bars, so they do not repaint.
Dashboard
A compact panel shows active bullish gaps, bearish gaps, inverted zones, plus the nearest demand level below price and the nearest supply level above it.
Alerts
Eight alert conditions cover the full lifecycle: new bullish/bearish gap, CE touch, fill, bullish/bearish inversion, and long/short IFVG retest.
█ HOW DETECTION WORKS
A bullish FVG forms when the current bar's low sits entirely above the high from two bars earlier — the zone spans that void. A bearish FVG is the mirror image. Detection runs only on bar close, so a gap that appears never disappears or redraws. Lifecycle state changes (CE touches, fills, inversions, retests) are likewise evaluated on confirmed bars.
█ HOW TO USE IT
1. Classic continuation: in a trend, wait for price to retrace into a fresh high-strength gap aligned with the trend; the CE midline is the standard entry refinement.
2. Inversion reversal: when a gap is closed through, stop looking for the old reaction — wait for the retest of the inverted zone in the new direction. The on-chart IFVG markers identify exactly this moment.
3. Multi-timeframe confluence: enable HTF mode and prioritize chart-timeframe signals that occur inside a higher-timeframe gap.
4. Use the dashboard's nearest demand/supply readout for quick situational awareness of where the next reaction zones sit.
Works on all symbols and timeframes. Crypto and index futures tend to produce the cleanest gaps on 5m–1H; forex gaps are more frequent on 15m and above.
█ SETTINGS
Detection — minimum gap size (× ATR), displacement filter, maximum zones kept on chart.
Mitigation & Inversion — inversion on/off, fill source (close or wick), removal of filled gaps, retest signals.
Multi-Timeframe — HTF on/off and timeframe selection.
Visuals — colors for bullish / bearish / inverted zones, fill transparency, CE line, labels, dimming of tested gaps, dashboard.
█ NOTES
— All state changes occur on closed bars; the developing bar can always change until it closes.
— This is an analysis tool for mapping imbalance and inversion zones, intended as a confluence layer within a complete trading plan. It is not a standalone buy/sell system.
█ DISCLAIMER
This script is provided for educational and informational purposes only and does not constitute financial advice. Trading involves substantial risk of loss. Past behavior does not guarantee future results. Always do your own research and apply sound risk management. 指標