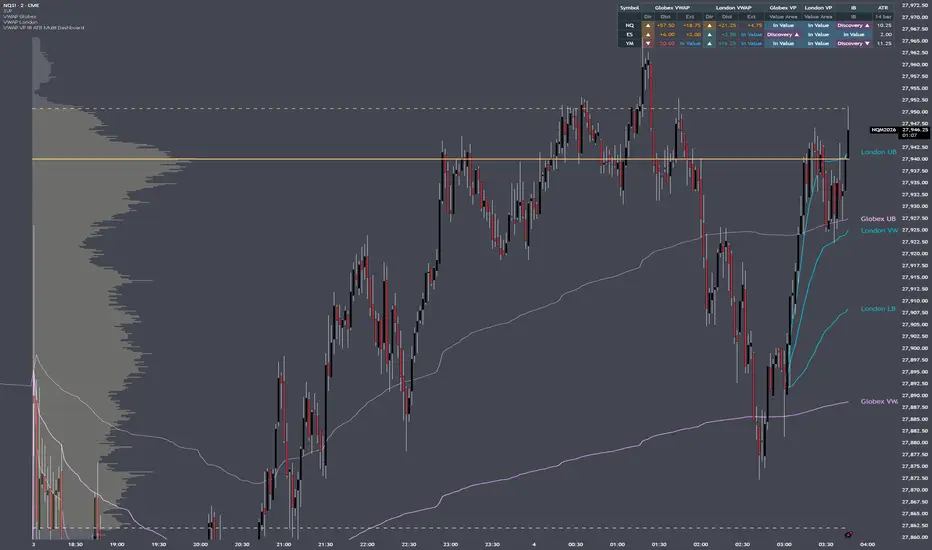
指標

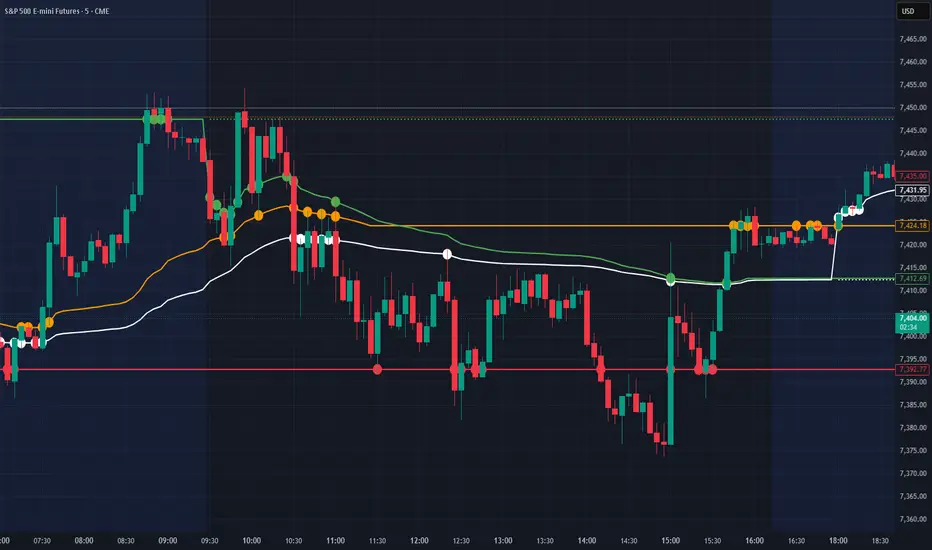
VWAPxLevels - OnlyFlowVWAPxLevels is a comprehensive VWAP-based indicator that combines real-time intraday volume-weighted average price calculations with previous-day reference levels. It's designed for traders who use VWAP and standard deviation bands as key support/resistance zones, with special offset functionality optimized for futures contracts like ES (E-mini S&P 500) and NQ (E-mini Nasdaq).
Key Features
Intraday VWAP with Triple Deviation Band Groups
The indicator plots the current session's VWAP along with three independently configurable groups of standard deviation bands:
Group 1 bands (default 1.0 stdev) for the inner mean-reversion zone
Group 2 bands (default 2.03 stdev) for moderate price extension zones
Group 3 bands (default 2.53 stdev) for extreme price extension zones
Each group can be toggled on or off and adjusted independently, giving you full control over which volatility layers are visible.
Previous Day Reference Levels
Automatically captures and plots the final values from the prior session:
Previous day's closing VWAP
Previous day's Group 1 upper and lower bands
Previous day's Group 2 upper and lower bands
Previous day's Group 3 upper and lower bands
These persistent levels often act as significant magnets and reaction zones in the current session.
Smart Offset Mode for Futures
A unique feature that applies preset offsets to previous-day levels, useful when trading correlated instruments or accounting for overnight gaps:
ES Mode: Applies a 0.5 point offset
NQ Mode: Applies a 2.5 point offset
None: Uses raw VWAP close values
When an offset mode is active, the indicator plots both upper and lower offset variations of the previous day's VWAP and all three deviation band groups, creating bracketed zones around each key level.
How to Use
The intraday VWAP serves as the session's mean price. Group 1 bands highlight the inner volatility envelope where price typically oscillates around fair value, while Group 2 and Group 3 bands identify progressively more extreme reversal or breakout zones. The previous day levels provide context from the prior session, helping identify areas where price has historically reacted. Use the offset mode when you want to create wider reaction zones or when trading futures contracts where slight adjustments to reference levels improve accuracy.
Customization
All three band groups and previous-day plots can be toggled independently through the input panel, letting you display only the levels relevant to your strategy. Deviation multipliers are fully adjustable to match your preferred volatility settings.
Best For
Day traders, scalpers, and futures traders who rely on VWAP-based mean reversion or breakout strategies and want layered volatility zones plus previous session reference levels integrated into a single clean indicator. 指標

VWAP Control Shift Map [AGPro Series]VWAP Control Shift Map
🧠 Core Idea
Has VWAP control shifted from mean reversion to directional acceptance?
📌 Overview / What it does
VWAP Control Shift Map is a VWAP control and acceptance visualization tool built to identify when price is balanced around value, accepted above control, accepted below control, or rejected back into the VWAP band.
The script builds a rolling volume-weighted control line, maps a VWAP control band, labels acceptance and rejection events, and summarizes the current VWAP state in a compact AG Pro panel.
This script does not predict future price direction, automate trades, or provide guaranteed buy/sell signals. It is a structured decision-support map for VWAP control, acceptance quality, mean-reversion risk, and shift context.
🎯 Purpose & Design Philosophy
VWAP is one of the most watched value references across intraday and swing trading contexts.
The problem is that price can cross VWAP many times without meaningful control transfer. This script was built to separate casual VWAP interaction from stronger acceptance, rejection, and reversion behavior.
The design philosophy is to make VWAP context visually readable: where control sits, which side is accepted, whether reversion risk is rising, and whether the shift has quality.
⚡ Why This Script Is Different
Most VWAP tools plot a line, add bands, and leave interpretation entirely to the user.
This script does NOT simply mark every VWAP touch as important and does NOT treat every cross as a trend signal.
Instead, it frames VWAP as a control zone: acceptance above, acceptance below, rejection back into value, and mean-reversion risk are all organized into one visual map.
⚙️ Methodology
1. VWAP Control Detection
The script calculates a rolling volume-weighted control line using price and volume over the selected control window.
2. Control Band Mapping
It builds a volatility-adjusted band around VWAP to represent the current value-control area.
3. Acceptance Evaluation
Consecutive closes outside the band are used to identify directional acceptance.
4. Rejection Evaluation
If price returns into the band after a shift, the script marks VWAP rejection behavior.
5. Visual Output
The chart displays the VWAP control line, bordered control zone, centered band label, event labels, right-side state tags, and AG Pro panel.
🗺️ How to Read the Chart
The VWAP control line represents the rolling volume-weighted value reference.
The control band represents the active VWAP acceptance area.
Labels mark acceptance, rejection, and mean-reversion events.
Right-side tags show the current control state and shift quality.
The panel summarizes VWAP control, acceptance state, control side, reversion risk, shift quality, control band, and next context.
🚦 Signals & States
• VWAP BALANCE → price has not established a clear accepted side
• ACCEPT ABOVE → price has accepted above the VWAP control band
• ACCEPT BELOW → price has accepted below the VWAP control band
• VWAP REJECTION → a control shift returned back into the band
• REVERSION RISK → price is back inside the band after a directional control state
🔔 Alerts Logic
VWAP Control Shift Up alert triggers when price accepts above the VWAP control band.
VWAP Control Shift Down alert triggers when price accepts below the VWAP control band.
VWAP Rejection alert triggers when price returns back into the band after a control shift.
Alerts are attention markers. They are not trade instructions.
🧩 Confluence Logic
The context becomes stronger when acceptance direction, VWAP slope, distance from VWAP, and candle body pressure align.
The context becomes weaker when price quickly returns into the control band after an attempted shift.
📊 When to Use
• VWAP-based intraday analysis
• Swing charts where volume-weighted value remains relevant
• Mean-reversion versus directional acceptance decisions
• Markets with liquid volume and clean price structure
• Trend continuation or failed acceptance review
⚠️ When NOT to Use
• Very illiquid symbols
• Markets with unreliable volume
• Extremely noisy low-timeframe charts
• News shock environments where VWAP control changes abruptly
• Any context where a single indicator is being used without broader structure
🎛️ Key Inputs
• VWAP Control Length → controls the rolling volume-weighted control window
• Band Volatility Length → controls how the band width is calculated
• Control Band Multiplier → adjusts VWAP control band width
• Acceptance Bars → defines how many closes are needed for acceptance
• Rejection Window → controls failed-shift timing
• Visual settings → control the panel, zone, labels, font sizes, and projection
🖥️ Interface & Visual Design
The interface is designed for clean, premium chart reading.
The VWAP band uses visible four-edge zone boundaries so the control area remains clear in both editor and published TradingView views.
The panel uses the AG Pro merged blue header standard and keeps the current context readable without covering the main chart.
🧪 Practical Usage Workflow
1. Read the panel state.
2. Check whether price is inside, above, or below the VWAP control band.
3. Review acceptance or rejection labels.
4. Compare shift quality with reversion risk.
5. Use broader market structure before making any decision.
🔍 Interpretation Guidelines
VWAP control is not a prediction.
Acceptance shows where price has spent enough time outside the control band to suggest directional control.
Rejection shows that the attempted control shift returned back toward value.
Mean-reversion risk increases when price moves back into the VWAP control area after directional acceptance.
🚫 What This Script Is NOT
This script is not a prediction engine.
It is not financial advice.
It is not an auto-trading system.
It does not guarantee profitable trades.
It does not replace risk management or independent analysis.
⚠️ Limitations & Transparency
VWAP behavior can vary by timeframe, market session, liquidity, and volume quality.
Rolling VWAP control may differ from exchange-session VWAP or anchored VWAP tools.
Extreme volatility can temporarily reduce the usefulness of control-band interpretation.
Outputs should always be interpreted within broader market context.
🧠 Market Context Notes
VWAP often works as a value reference, but value can shift when acceptance becomes persistent.
A clean control shift is stronger when price accepts outside the band while VWAP slope supports the move.
A weak shift often returns back into the band and becomes a rejection or mean-reversion context.
🧾 Use Case Examples
When price accepts above the VWAP control band with strong shift quality, the chart may be showing directional control above value.
When price accepts below the band and VWAP turns down, the control context may favor downside acceptance.
When price quickly returns into the band after acceptance, VWAP rejection risk becomes more important.
🧱 System Philosophy
AGPro Series tools are built to convert complex market behavior into visual decision maps.
The goal is not certainty. The goal is structured context, cleaner interpretation, and better chart discipline.
🔐 Non-Promise Statement
No script can know the future.
No signal is certain.
No visual state should be treated as a guaranteed outcome.
📉 Risk Disclosure
Trading involves risk.
Markets can move unexpectedly.
Users are responsible for their own decisions, risk management, and trade execution.
This script does not provide financial advice.
📚 Educational Note
This tool is intended for educational and analytical use. It can help traders study VWAP control, acceptance shifts, rejection behavior, and mean-reversion risk.
指標

VWAP Suite [ChartSmith]
VWAP Suite — ChartSmith
*, *::before, *::after { box-sizing: border-box; margin: 0; padding: 0; }
body {
font-family: -apple-system, BlinkMacSystemFont, "Segoe UI", Roboto, "Helvetica Neue", Arial, sans-serif;
background: #0d1117;
color: #c9d1d9;
line-height: 1.7;
padding: 48px 24px;
}
.container {
max-width: 860px;
margin: 0 auto;
}
/* ── Header ── */
header {
border-bottom: 1px solid #21262d;
padding-bottom: 32px;
margin-bottom: 40px;
}
header h1 {
font-size: 2rem;
font-weight: 700;
color: #f0f6fc;
letter-spacing: -0.5px;
margin-bottom: 12px;
}
.meta {
display: flex;
flex-wrap: wrap;
gap: 12px;
}
.badge {
display: inline-block;
font-size: 0.75rem;
font-weight: 600;
letter-spacing: 0.04em;
text-transform: uppercase;
padding: 3px 10px;
border-radius: 20px;
background: #1f2937;
color: #94a3b8;
border: 1px solid #374151;
}
/* ── Sections ── */
section {
margin-bottom: 48px;
}
h2 {
font-size: 1.25rem;
font-weight: 600;
color: #f0f6fc;
margin-bottom: 16px;
padding-bottom: 8px;
border-bottom: 1px solid #21262d;
}
h3 {
font-size: 1rem;
font-weight: 600;
color: #e2e8f0;
margin: 24px 0 10px;
}
p {
margin-bottom: 14px;
color: #c9d1d9;
}
/* ── Tables ── */
.table-wrap {
overflow-x: auto;
margin-bottom: 14px;
}
table {
width: 100%;
border-collapse: collapse;
font-size: 0.9rem;
}
thead tr {
background: #161b22;
}
th {
text-align: left;
padding: 10px 14px;
font-weight: 600;
color: #8b949e;
font-size: 0.78rem;
text-transform: uppercase;
letter-spacing: 0.06em;
border-bottom: 1px solid #21262d;
}
td {
padding: 10px 14px;
border-bottom: 1px solid #161b22;
color: #c9d1d9;
vertical-align: top;
}
tbody tr:last-child td {
border-bottom: none;
}
tbody tr:hover td {
background: #161b22;
}
td strong, td code {
color: #e2e8f0;
}
/* ── Callout ── */
.callout {
background: #161b22;
border-left: 3px solid #3b82f6;
border-radius: 0 6px 6px 0;
padding: 16px 20px;
margin: 20px 0;
font-size: 0.92rem;
}
.callout p {
margin: 0;
color: #c9d1d9;
}
/* ── Priority chain ── */
.priority {
display: flex;
align-items: center;
gap: 10px;
flex-wrap: wrap;
margin: 16px 0;
}
.priority-item {
background: #1f2937;
border: 1px solid #374151;
border-radius: 6px;
padding: 6px 14px;
font-size: 0.85rem;
font-weight: 600;
color: #e2e8f0;
}
.priority-arrow {
color: #4b5563;
font-size: 1rem;
}
.priority-end {
color: #6b7280;
font-size: 0.85rem;
font-style: italic;
}
/* ── Use case list ── */
ul {
list-style: none;
padding: 0;
}
ul li {
padding: 10px 0 10px 20px;
border-bottom: 1px solid #161b22;
position: relative;
color: #c9d1d9;
font-size: 0.92rem;
}
ul li:last-child {
border-bottom: none;
}
ul li::before {
content: "→";
position: absolute;
left: 0;
color: #3b82f6;
font-weight: 700;
}
ul li strong {
color: #e2e8f0;
}
/* ── Default badge in table ── */
.default-tag {
font-size: 0.7rem;
font-weight: 600;
color: #3b82f6;
background: #1e3a5f;
border: 1px solid #2563eb44;
border-radius: 4px;
padding: 1px 6px;
margin-left: 6px;
vertical-align: middle;
white-space: nowrap;
}
footer {
margin-top: 64px;
padding-top: 24px;
border-top: 1px solid #21262d;
font-size: 0.78rem;
color: #484f58;
text-align: center;
}
VWAP Suite
CS · VWAP
TradingView · Pine Script v5
Overlay
ChartSmith
Overview
VWAP Suite is a professional-grade Volume Weighted Average Price indicator designed for traders who need
precise session-aware VWAP anchoring with configurable standard deviation bands. The indicator supports
six distinct anchor periods, up to three independently styled deviation bands with fill regions, and an
optional candle-coloring system that visually signals price extension beyond any band level.
Anchor Modes
The anchor determines when the VWAP calculation resets and begins accumulating a fresh volume-weighted
average. All session-based anchors align to US Eastern Time.
Anchor
Reset Point
ETH Session
6:00 PM ET each evening (CME futures session open)
RTH Session
9:30 AM ET each trading day (NYSE / NASDAQ open)
Weekly
Sunday 6:00 PM ET (CME week open); falls back to Monday open on equity-only charts
Monthly
6:00 PM ET on the last calendar day of the month
Quarterly
First bar of each new calendar quarter
Yearly
First bar of each new calendar year
RTH Session Behavior
When RTH Session is selected, the VWAP and all bands are displayed exclusively during
Regular Trading Hours (9:30 AM – 4:15 PM ET). Outside of this window — including pre-market and
after-hours bars — the indicator goes completely blank. A fresh VWAP begins drawing at each 9:30 AM open
and stops cleanly at 4:15 PM, regardless of whether the chart itself is set to display extended or
regular hours.
Manual Anchor Override
An optional time override allows the anchor reset to be set to any 24-hour ET time of your choosing,
entered in HHMM format (e.g., 0930 for 9:30 AM, 1800 for 6:00 PM). When
enabled, this overrides the selected anchor mode's default reset time.
Standard Deviation Bands
Up to three independent standard deviation bands can be displayed above and below VWAP. Each band is
configured separately and can be enabled or disabled without affecting the others.
Each band offers:
Show/Hide toggle — enables or disables the upper and lower band lines
Multiplier — controls the width of the band as a multiple of the session's volume-weighted standard deviation (e.g., 1.0×, 2.0×, 3.0×)
Line color — independently styled per band
Fill to the adjacent boundary — shades the region between the band and its inner neighbor (Band 1 fills to VWAP; Band 2 fills to Band 1; Band 3 fills to Band 2), each with its own fill color
Line weight and line style (solid, dashed, dotted) are adjusted via TradingView's built-in Style tab on the indicator settings panel.
Default Band Configuration
Band
Default Multiplier
Default State
Band 1
1.0×
Enabled
Band 2
2.0×
Disabled
Band 3
3.0×
Disabled
Candle Coloring
Each band includes an optional Color Candles feature. When enabled for a given band,
candles whose closing price lies outside that band's upper or lower boundary are painted with a
user-defined color. This provides an immediate visual cue for price extension without requiring a
separate indicator.
Four candle color slots are available per band:
Above upper band — bullish candle (close ≥ open)
Above upper band — bearish candle (close < open)
Below lower band — bullish candle
Below lower band — bearish candle
Priority
When multiple bands have candle coloring enabled, the outermost active signal takes precedence:
Band 3
›
Band 2
›
Band 1
›
default chart color
A candle that is outside Band 3 will display the Band 3 color regardless of Band 1 or Band 2 settings.
When RTH Session is selected as the anchor, candle coloring is automatically suspended outside of trading hours so that off-hours candles always render in their default chart color.
Price Source
The price used as input to the VWAP calculation is configurable:
Option
Formula
OHLC/4 default
(Open + High + Low + Close) ÷ 4
HLC/3
(High + Low + Close) ÷ 3
HL/2
(High + Low) ÷ 2
Close
Closing price
Open
Opening price
High
High price
Low
Low price
Settings Reference
Group
Setting
Description
Anchor
Anchor To
Selects the VWAP reset period
Anchor
Override Anchor Time
Enables a custom reset time
Anchor
Manual Anchor Time
The custom reset time in HHMM, 24-hour ET
VWAP
VWAP (toggle + color)
Shows or hides the VWAP line
Band 1–3
Standard Deviation
Shows or hides the band lines; sets the multiplier and color
Band 1–3
Fill
Enables the fill region and its color
Band 1–3
Color Candles
Enables candle coloring for that band's boundary
Band 1–3
▲ Up / Down
Colors for candles above the upper band
Band 1–3
▼ Up / Down
Colors for candles below the lower band
Source
Price Source
The OHLC formula used as the VWAP input
Intended Use Cases
Intraday traders using RTH Session anchor to track the day's volume-weighted fair value with a clean visual reset at each session open and close
Futures traders using ETH Session anchor aligned to the CME open at 6:00 PM ET
Swing traders using Weekly or Monthly anchors to identify longer-term institutional value areas
Extended session traders who need the standard deviation bands to identify potential mean-reversion or breakout levels relative to the accumulated session VWAP
Active traders who want immediate candle-level feedback when price moves into statistically significant extension zones beyond one, two, or three standard deviations
VWAP Suite · CS · VWAP · TradingView Pine Script v5
指標

指標

策略
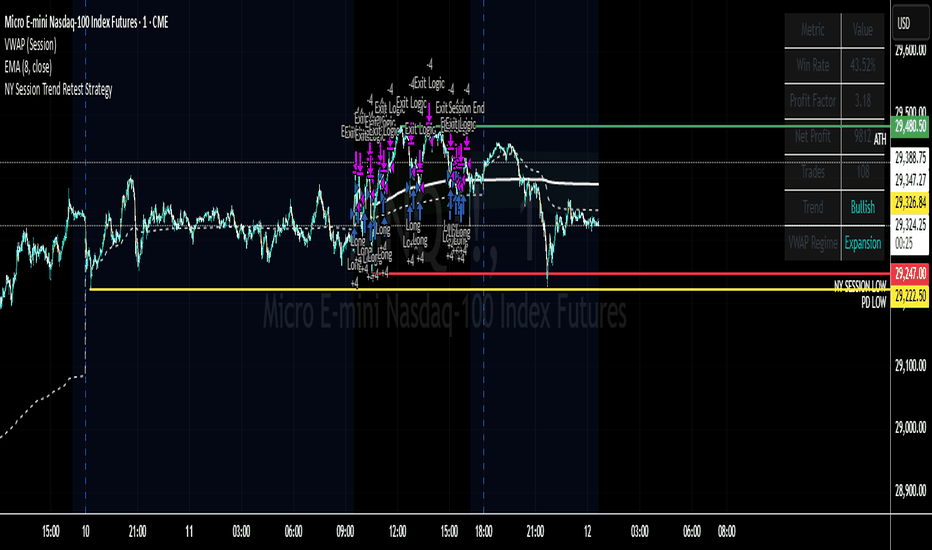
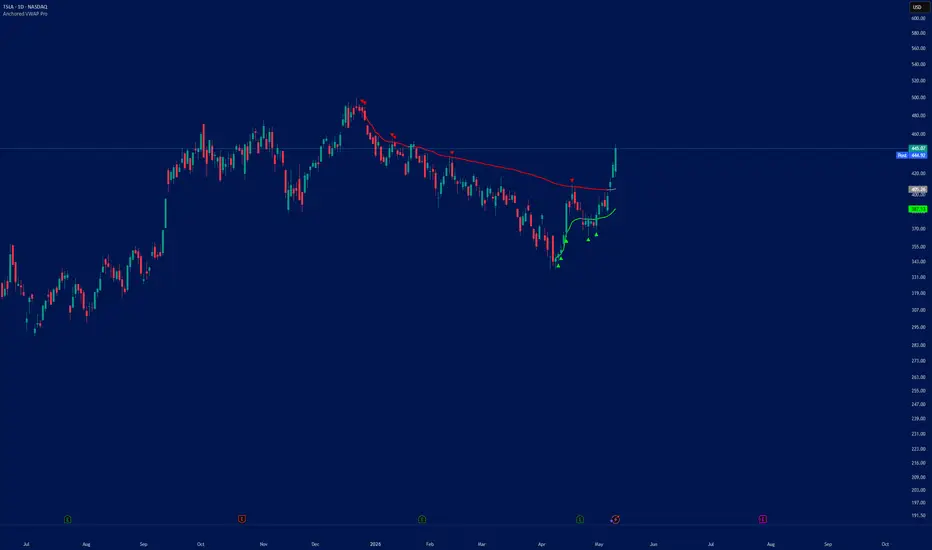
Anchored VWAP Pro#Anchored VWAP Pro
by: MasterTonyTA
## What it does
VERY SIMPLE MARK TOPS MARK BOTTOMS- SUPPORT AND RESISTANCE SHOWN
ANCHORED VWAP SHOWS YOU IMPORTANT LEVELS TO KEEP AN EYE TO FLIP, REJECT, OR HOLD
Two anchored VWAPs (top and bottom) with **color memory** — each line stays colored while holding as S/R, turns gray when broken — plus **real-time triangles** marking every wick rejection at the top and bounce at the bottom. Anchors can be set manually via the date/time input in settings, or dragged directly on the chart for fast experimentation.
---
## How it's calculated
**VWAP** (close-based, cumulative from anchor):
```
VWAP = Σ(close × volume) / Σ(volume)
```
Starts at the user-selected anchor bar and accumulates forward.
**Color logic:**
- **Top VWAP** — red while `close < VWAP` (resistance holding), gray when `close > VWAP` (broken)
- **Bottom VWAP** — green while `close > VWAP` (support holding), gray when `close < VWAP` (broken)
**Triangles** (wick-based, fires same bar):
- **🔻 Top Rejection** — `high ≥ Top VWAP` and `close < Top VWAP`
- **🔺 Bottom Bounce** — `low ≤ Bottom VWAP` and `close > Bottom VWAP`
---
## How to trade with it
1. **Anchor the top** to a major swing high — the red line is dynamic resistance from that pivot.
2. **Anchor the bottom** to a major swing low — the green line is dynamic support from that pivot.
3. **Read the state:**
- Red top + green bottom = price inside a dynamic channel, fade the edges
- Top turns gray = resistance broken, look for retest as new support
- Bottom turns gray = support broken, look for retest as new resistance
4. **Trade the triangles:**
- 🔻 = short the rejection, stop above the wick
- 🔺 = long the bounce, stop below the wick
Best anchors are pivots that already matter — major highs, major lows, capitulation candles. Drag the anchor to test different points; the right one is where price clearly respects the line.
---
指標

Volume-Filtered Pivot Zones [ky_yule1010]Volume-Filtered Pivot Zones
Detects swing pivots only when they occur on meaningful volume, then clusters them into weighted support/resistance zones using ATR-based proximity. The result is a clean, adaptive S/R map that evolves with the market rather than cluttering the chart with every minor swing.
Core Concept
Not all pivots are equal. A swing high printed on 2× relative volume carries far more institutional weight than one on dead tape. This indicator filters pivots through a configurable RVOL threshold (rolling SMA or time-of-day normalized), retains only the validated ones in a managed pool, and merges nearby pivots into zones using RVOL-weighted centroids. Zones closer to price activate; distant ones sit dormant until price revisits.
Why It Works
High-RVOL pivots act as gravity — price tends to revisit levels where significant volume transacted, making these zones natural magnets for mean-reversion and re-tests.
Pivot-anchored VWAP resets on each validated pivot, giving you a more responsive fair-value reference than session or fixed-anchor VWAP. It adapts to the market's actual turning points rather than arbitrary time boundaries.
Key Features
LTF Volume-Weighted mode — pivots are detected on wicks but the S/R line is drawn at the micro-VWAP from lower-timeframe bars, pinpointing where volume actually concentrated at the turning point.
Zone weight scoring — each zone carries a weight (touch count × average RVOL) so you can immediately see which levels have the deepest structural backing.
Volume gradient heatmap — visualizes volume density above and below active zones, highlighting friction (price slows) vs. voids (price rips).
Fair Value Gap detection — flags statistically large FVGs (P75+) as potential re-fill targets.
Comprehensive Gradient Score (CGS) — blends density asymmetry, ATR-normalized slope, acceleration, and rejection quality into a single directional bias reading.
Structure bias tracking — HH/HL vs. LH/LL sequence detection with staleness decay and price-position overrides.
Full data export — nearest S/R levels, distances, zone weights, RVOL, slope, acceleration, rejection quality, and CGS all plotted to the status line and data window.
Suggested Use
Use zone weight and the volume gradient to gauge conviction at each level — heavy zones with dense volume below support (or above resistance) tend to hold. Thin zones sitting in a volume void are breakout candidates. The CGS and density bias readings provide at-a-glance directional context without needing a separate oscillator. 指標

Anchored Volume Weighted Average Price | Astral Vision Anchored Volume Weighted Average Price | Astral Vision 🌠💠
The Volume Weighted Average Price anchored to a fixed date represents the average price at which every Bitcoin has changed hands since that moment, weighted by volume.
Unlike a moving average which weights bars equally by time an anchored VWAP weights each bar by its trading activity, making it a true reflection of the average cost basis for all market participants who entered after the anchor point.
When price trades above an anchored VWAP, the aggregate of participants since that anchor is in profit. When price trades below it, they are in loss.
This makes anchored VWAPs among the most reliable dynamic support and resistance levels available, as they represent the price at which the largest volume of participants is either defending a gain or protecting against a loss.
This indicator plots up to 16 simultaneous anchored VWAPs: one per calendar year from 2013 through 2025, plus three fully custom anchors at any user-defined date, all on the price chart with individual color control and labeled at the current bar.
Calculation ⚙️
`VWAP = Cumulative(HLC3 × Volume) / Cumulative(Volume)`
Accumulation begins on the first bar of the anchor year (or the exact timestamp for custom anchors) and runs continuously to the present bar. Each VWAP is computed independently, carrying its own cumulative price-volume and volume sums from its respective start date.
Plots 📊
Up to 13 year-anchored VWAP lines (2013–2025), each with a dual-layer glow (linewidths 6/2, transparency 80/0)
3 custom timestamp-anchored VWAP lines with the same glow rendering
Labeled endpoints at the current bar for every active VWAP, showing year or custom identifier
Inputs 🎛️
`2013` through `2025` :individual toggles to enable each year-anchored VWAP, each with its own color picker
`Custom 1 / 2 / 3`: toggles for three free-anchor VWAPs, each with a date/time input and color picker
Colors 🎨
Each VWAP line has its own independent color, pre-assigned along a spectral progression from violet (2013) through the visible spectrum to yellow (2025), giving each cycle year a visually distinct identity at a glance. Custom anchors default to blue, yellow, and green with full override available.
Purpose 🎯
Standard VWAP tools on TradingView anchor to the current session or a single user-defined point, offering no way to compare multiple historical anchors simultaneously. Traders who want to assess confluence across different cycle entry points must place and manage anchors manually, one at a time.
This indicator solves that entirely: all major Bitcoin calendar years are available as one-click toggles, letting you layer any combination of historical cost bases onto the chart instantly. The custom anchors extend this to any structurally significant date (cycle lows, halving events, ETF approvals) without any manual drawing tool interaction. Confluence zones where multiple VWAPs converge are immediately visible and have historically acted as the strongest support and resistance levels in Bitcoin's price structure.
Disclaimer ⭕️
It is not financial advice, not an investment recommendation, and not affiliated with any financial institution, research firm, or organization of any kind. All content is provided for educational and informational purposes only. Always conduct your own research before making any financial decision. 指標

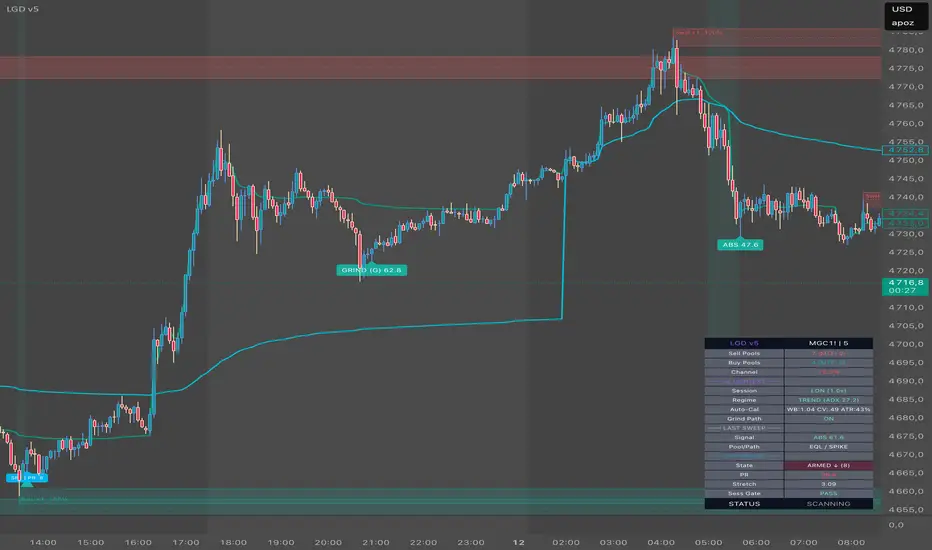
Liquidity Grab Detector v4What is this and why do you need it?
The indicator shows where the market maker is hunting stops and when the price is likely to reverse afterwards.
The logic is simple: before a reversal, price often sweeps beyond a key level, takes out retail traders’ stop-losses, and then reverses back. This is called a Liquidity Grab. LGD v4 detects these moments and evaluates the quality of each signal from 0 to 100.
What you see on the chart
Colored zones — Liquidity pools where stops have accumulated. The more touches, the more stops are sitting there.
Signal label (e.g. REJ 72 or ABS 85) — The word is the reversal type, the number is the signal quality (0–100).
Green/Red background — The system is “armed” and waiting for confirmation to enter.
TP and SL lines — Appear only on a valid signal. SL is always placed behind the probe extreme, not on the level itself.
Four Types of Signals
A+ (85–100) — Rare, enter with full size
A (70–84) — Strong signal
B (50–69) — Good, use with additional confirmation
C (<50) — Skip or only in perfect context
TypeIn Simple TermsShould You Enter?ABS (Absorption)A big player absorbed all the pressure with a wall of ordersYes, full sizeREJ (Rejection)Sharp rejection — nobody wanted to continue buying/sellingYes, full sizeDIV (Divergence)Came in with volume but couldn’t holdHalf sizeEXH (Exhaustion)Quiet sweep on low volume, unclear strengthBetter to skip
Simple Entry Algorithm
Check the 1H chart — what’s the daily bias (up or down)?
Check the 5M chart — is LGD showing a signal in the same direction?
Is the signal type ABS or REJ with score above 60?
Place SL where the red box is, and TP at the next liquidity zone.
If any of these conditions aren’t met — skip the trade.
Best Trading Times
Trade Tuesday to Thursday, during the window 09:45–11:30 ET.
Avoid trading on NFP, FOMC, and CPI days — signals are unreliable during high-impact news.
What the Indicator Does
LGD v4 is a liquidity sweep detector for CME micro-futures. It combines three independent engines:
Pool Engine — Creates dynamic liquidity pools from swing highs/lows with a full lifecycle: birth → touches → sweep → death.
Sweep Scoring — Evaluates every sweep using 11 different criteria (0–100 score) and determines the type of reversal.
SFP Trigger Engine — AVWAP exhaustion + percentile rank gating + BOS confirmation.
How to Read the Chart
ElementMeaningColored zones (rectangles)Liquidity pools labeled: source × touches, health%REJ 72.4 / ABS 85.1Reversal type + score out of 100 on sweepSFP | PR 7.2BullByte-style trigger with percentile rankTeal lineImpulse AVWAP (resets on every N-bar extreme)Aqua lineDaily AVWAP (resets every day)Dark green backgroundArmed Long — system is ready, waiting for BOS upDark red backgroundArmed Short — system is ready, waiting for BOS downSFP / SFP-LSwing Failure Pattern (Pivot / Level)Green/Red boxRisk Zone: SL + TP1 + TP2
Reversal Types
TypeWhat HappenedSignal StrengthRecommended SizingABS (Absorption)Large limit order absorbed the stop flow. Huge volume, strong wick★★★★★Full sizeREJ (Rejection)Volume delta opposite to sweep direction★★★★☆Full sizeDIV (Divergence)High volume pushed into the zone, but close didn’t hold★★★☆☆Half sizeEXH (Exhaustion)Sweep on thin volume, weak rejection★★☆☆☆Skip or 1/4 size
指標
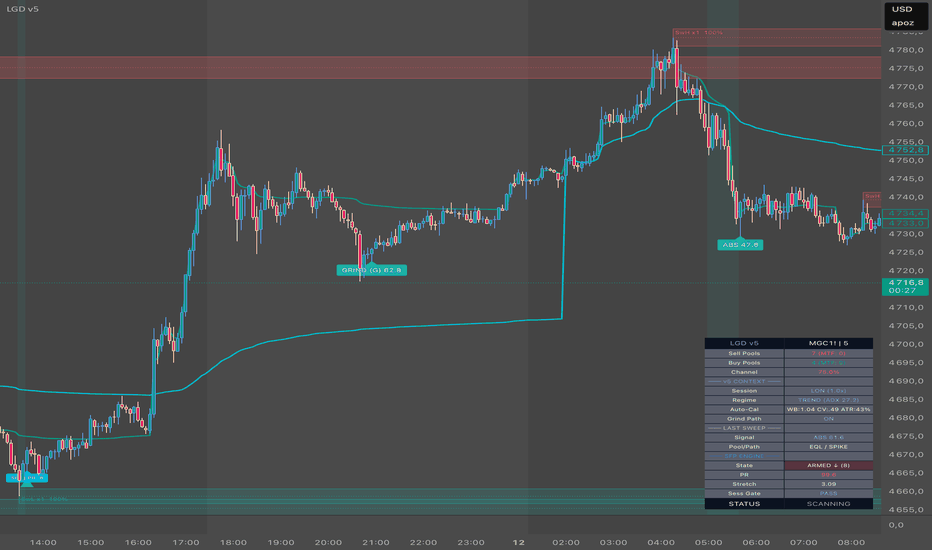
Smooths VWAP SuiteTitle: Smooth's VWAP Suite: Advanced Futures Context & Filtered Signals
Description:
Overview & Purpose
Smooth's VWAP Suite is a comprehensive volume-weighted average price toolkit engineered specifically for futures traders (e.g., NQ, ES).
The primary justification for combining these specific elements—Daily VWAP, Standard Deviation Bands, Session AVWAPs (Overnight, RTH, Weekly), and dynamic signals—into a single script is to solve the problem of "context fragmentation." Futures markets respect multiple volume anchors simultaneously. Rather than cluttering a chart with five individual, unlinked indicators, this suite unites micro (intraday) and macro (weekly) volume levels into one cohesive map. Furthermore, it introduces a custom "Current Day Only" filter mathematically anchored to the 18:00 EST futures open, fixing the common issue where standard indicators rely on the midnight calendar-day rollover.
How It Works: Underlying Concepts & Logic
This script calculates the Volume-Weighted Average Price by maintaining a cumulative running total of Price × Volume, divided by Total Volume.
Session AVWAPs & Previous Day: The script calculates distinct VWAPs based on specific time anchors. It automatically tracks the Weekly open, the Regular Trading Hours (RTH) open, and the Overnight (OVN) session. It also statically plots the Previous Day's closing VWAP value, acting as a critical pivot for the current session.
Standard Deviation Variance: The bands surrounding the Daily VWAP are calculated using the mathematical square root of volume-weighted variance. This provides dynamic, mathematically sound support and resistance zones based on current market volatility, plotted at user-defined multipliers (defaulting to 1.0, 2.0, and 3.0 SD).
Signal Engine & EMA Filter: The built-in signals are not basic crossovers. To prevent false signals in chopping ranging markets, the script requires an EMA (Exponential Moving Average) directional filter to confirm the trend.
Reversal/Cross Signals: Trigger when price straddles the VWAP, closes on the opposite side, is aligned with the EMA slope, and is positioned correctly relative to the Weekly VWAP.
Continuation Signals: Trigger when price pushes into a Standard Deviation band (e.g., SD 1 or SD 2) and actively rejects it, closing back toward the trend direction while maintaining the EMA slope.
How Traders Can Use It
This suite is designed for trend identification, mean-reversion targeting, and precise entry confirmation.
Macro Context Alignment: Use the Weekly and Previous Day VWAP lines to determine the broader bias. If the current Daily VWAP is trading above both, the macro trend is bullish.
Mean Reversion: When price extends into the SD 2 or SD 3 bands, the asset is statistically overextended based on current volume. Traders can look for price action weakness at these extremes to target a reversion back to the Daily VWAP (the mean).
Signal Execution: Utilize the script's visual markers (Arrows/Triangles) for entry confirmations. A bullish signal firing after a bounce off the lower SD 1 band, while the Daily VWAP remains above the Weekly VWAP, offers a high-probability continuation setup.
Chart Decluttering: For active day traders, toggle the "Current Day Only" setting. This utilizes custom logic to sever all historical visual data prior to the exact 18:00 EST futures anchor, keeping your screen entirely focused on the current session's price action.
Customization
Every element is modular. Traders can toggle specific bands, adjust standard deviation multipliers, change the EMA filter length for signals, and customize the visual offsets of the price labels to fit their specific screen layout. 指標
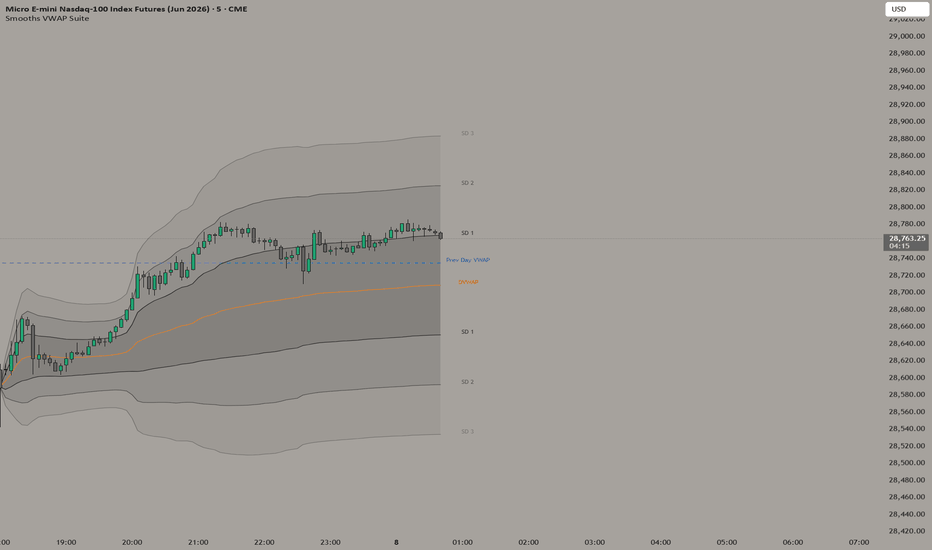
Anchored VWAP Risk Ladder [AGPro Series]Anchored VWAP Risk Ladder
🧠 Core Idea
After an important market event, is price trading close to fair value or becoming extended relative to the anchored VWAP?
📌 Overview / What it does
Anchored VWAP Risk Ladder builds a volume-weighted average price from a selected anchor event and turns the distance from that anchor into a structured risk ladder.
The script displays anchored VWAP, volume-weighted deviation bands, right-side ladder tags, reclaim and lose labels, extension context, and a compact AG Pro panel with distance, score, risk ladder, and action state.
It does not predict price direction, automate trades, or claim that anchored VWAP will hold as support or resistance. It organizes event-based volume-weighted context into a readable chart framework.
🎯 Purpose & Design Philosophy
Anchored VWAP is often useful after a meaningful event, but raw AVWAP alone can be difficult to interpret without context.
This script was built to answer a practical question: how far is price from the anchored value area, and is that distance becoming useful, balanced, or risky?
The design supports traders who think in terms of anchored fair value, risk distance, reclaim behavior, and extension zones.
⚡ Why This Script Is Different
Most VWAP tools show a line and leave interpretation fully manual.
This script does NOT stop at plotting anchored VWAP.
Instead, it builds a complete risk ladder around the anchor, adds deviation context, scores reclaim or lose behavior, and summarizes the current state in a clean dashboard.
⚙️ Methodology
1. Anchor Detection
The script can anchor from manual time, high-volume events, swing pivots, session open, week open, or month open.
2. AVWAP Calculation
From the active anchor, the script accumulates volume-weighted price and volume-weighted variance to calculate anchored VWAP and deviation bands.
3. Risk Ladder Mapping
Distance from anchored VWAP is measured in ATR and deviation terms to classify whether price is near value, inside Band 1, inside Band 2, or extended.
4. Visual Output
The script plots AVWAP, upper/lower deviation bands, ladder fills, event labels, right-side tags, bar state color, and a dashboard.
🗺️ How to Read the Chart
The AVWAP rail represents the volume-weighted average price from the active anchor.
Deviation bands represent the ladder around anchored value.
Labels mark anchor events, AVWAP reclaim events, AVWAP lose events, and optional extension-risk conditions.
The panel shows:
• Anchor → current anchor type and age
• Distance → price distance from AVWAP in ATR
• Risk Ladder → current ladder zone and risk score
• Score → current context score and direction state
• Action → READY / MONITOR / WAIT / BLOCKED
🚦 Signals & States
• Anchor Locked → a new event anchor has been selected
• Ready Reclaim → price has reclaimed anchored VWAP with enough context score
• Ready Lose → price has lost anchored VWAP with enough context score
• Near AVWAP → price is close to anchored value
• Band 1 / Band 2 → price is moving away from anchored value
• Extended → distance from AVWAP is elevated
🔔 Alerts Logic
Alerts can trigger when a new anchor is locked, when price reclaims AVWAP, when price loses AVWAP, or when extension-risk conditions appear.
Alerts are attention markers only. They do not represent trade instructions or guaranteed outcomes.
🧩 Confluence Logic
The context becomes stronger when anchored VWAP reclaim or lose behavior aligns with relative volume, acceptable distance, and a clear ladder state.
The risk ladder helps separate balanced conditions from extension conditions.
📊 When to Use
• After high-volume market events
• Around earnings, news, breakout, or liquidation-style candles
• During trend continuation pullbacks
• When studying institutional average price context
• On liquid symbols with meaningful volume data
⚠️ When NOT to Use
• Very low-liquidity symbols
• Markets with unreliable or synthetic volume
• Extremely choppy conditions where anchors reset too often
• Situations where the selected anchor is not meaningful
• When using AVWAP as a standalone trading signal
🎛️ Key Inputs
• Anchor Mode → controls how AVWAP is anchored
• Manual Anchor Time → user-defined anchor timestamp
• High Volume Anchor Threshold → controls automatic high-volume anchors
• Deviation Band 1 / 2 → controls ladder width
• Extension Risk ATR → controls when distance becomes elevated
• Minimum Ready Score → controls reclaim or lose strictness
• Visual Settings → control bands, labels, tags, panel, and bar colors
🖥️ Interface & Visual Design
The interface is built for fast visual hierarchy.
AVWAP is the central reference, deviation bands define the risk ladder, right-side tags make the ladder readable, and the panel summarizes state without forcing the user to inspect every line manually.
🧪 Practical Usage Workflow
1. Choose the anchor mode
2. Read the active anchor and distance in the panel
3. Check whether price is near AVWAP or extended
4. Watch reclaim or lose labels around AVWAP
5. Use broader structure and risk context before making any decision
🔍 Interpretation Guidelines
Price near AVWAP often represents a balanced value area relative to the anchor.
Price far from AVWAP may represent stronger trend behavior, but it may also carry extension risk.
READY states mark meaningful reclaim or lose behavior, not certainty.
🚫 What This Script Is NOT
This script is not a prediction engine.
It is not an automated trading system.
It does not guarantee support, resistance, continuation, reversal, or profit.
It is not financial advice.
⚠️ Limitations & Transparency
Anchored VWAP quality depends heavily on anchor selection.
Different timeframes may produce different anchor timing and visual structure.
Volume data quality may vary between symbols, brokers, and exchanges.
Deviation bands are statistical references, not fixed market boundaries.
🧠 Market Context Notes
Anchored VWAP works best when the anchor represents a meaningful market event.
High-volume displacement, swing pivots, session opens, weekly opens, and monthly opens may each tell a different story.
The user should choose the anchor mode that best fits the market question.
🧾 Use Case Examples
When a high-volume candle creates a new anchor, the script tracks whether price remains near the anchored value area or begins to extend away from it.
When price reclaims AVWAP with enough score, the script marks a READY reclaim context.
When price loses AVWAP with enough score, the script marks a READY lose context.
🧱 System Philosophy
AGPro Series tools are built as decision-support engines.
The purpose is to structure market context into readable zones, states, scores, and risk references without turning analysis into blind signal-following.
🔐 Non-Promise Statement
No script can provide certainty.
No AVWAP level guarantees a reaction.
No signal guarantees continuation, reversal, or profit.
📉 Risk Disclosure
Trading involves risk.
Users are responsible for their own analysis, decisions, risk management, and execution.
This script is for educational and analytical purposes only and does not provide financial advice.
📚 Educational Note
Use this tool to study how anchored value, volume-weighted distance, deviation bands, reclaim behavior, and extension risk interact across different market conditions.
指標

VWAP Pullback Reclaim Planner [AGPro Series]VWAP Pullback Reclaim Planner
🧠 Core Idea
Has price pulled back into VWAP and reclaimed it with enough quality to deserve attention?
📌 Overview / What it does
VWAP Pullback Reclaim Planner is a volume-weighted price action tool designed to evaluate pullbacks around VWAP and highlight reclaim conditions with a structured readiness score.
The script maps VWAP, a pullback pocket, reclaim corridors, invalidation shelves, target rails, labels, and a compact AG Pro dashboard. It focuses on whether price has moved away from VWAP, reacted, and returned through the reference with enough quality.
It does not predict future price movement, automate trading, or provide buy/sell commands. It is a visual decision-support framework for reading VWAP reclaim context.
🎯 Purpose & Design Philosophy
This script was built for traders who use VWAP as a live market reference but need more structure than a single line on the chart.
Many VWAP tools show the average price only. This planner adds context: pullback depth, reclaim quality, reaction strength, room, invalidation, and next-action state.
The design philosophy is simple: make VWAP reclaim situations easier to read without turning them into mechanical signals.
⚡ Why This Script Is Different
Most tools focus on plotting VWAP as a static benchmark.
This script does NOT treat every VWAP touch as meaningful.
Instead, it waits for a pullback, checks reclaim behavior, scores the reaction, and then presents the result through zones, labels, target rails, and a clear READY / MONITOR / WAIT / INVALIDATED state.
⚙️ Methodology
1. Context Detection
The script builds an anchored VWAP from the selected anchor mode and monitors price distance from that volume-weighted reference.
2. Reference Mapping
It creates a VWAP pullback pocket using ATR depth so the zone adapts to current volatility.
3. Reaction Evaluation
When price reclaims VWAP after a pullback, the script evaluates close distance, wick response, body quality, relative volume, VWAP slope alignment, and freshness.
4. Visual Output
Qualified events are shown with reclaim labels, a reclaim corridor, invalidation shelf, target rails, right-side tags, and a panel summary.
🗺️ How to Read the Chart
VWAP line shows the active volume-weighted reference.
The shaded pocket around VWAP marks the pullback area where reaction quality is evaluated.
READY RECLAIM labels highlight reclaim events that pass the selected score threshold.
The reclaim corridor shows the active continuation area after a valid reclaim.
The invalidation shelf marks where the reclaim context weakens.
The AG Pro panel summarizes VWAP State, Reclaim Score, Pullback Quality, Room, and Action.
🚦 Signals & States
• READY RECLAIM → price reclaimed VWAP after a pullback with enough quality.
• VWAP PULLBACK → price is inside or beyond the pullback pocket and may deserve monitoring.
• INVALIDATED → an active reclaim context lost its invalidation shelf.
• READY → a qualified reclaim event is active.
• MONITOR → a reclaim or pullback context is active but not a fresh ready event.
• WAIT → no actionable VWAP reclaim context is active.
• BLOCKED → VWAP or volatility context is not valid enough for evaluation.
🔔 Alerts Logic
Bullish VWAP Reclaim Ready triggers when price reclaims VWAP upward after a valid pullback and score threshold is met.
Bearish VWAP Reclaim Ready triggers when price reclaims VWAP downward after a valid pullback and score threshold is met.
VWAP Pullback Watch triggers when price enters the pullback evaluation area.
VWAP Reclaim Invalidated triggers when an active reclaim loses its invalidation shelf.
Alerts are attention markers, not trade instructions.
🧩 Confluence Logic
The strongest contexts appear when pullback freshness, VWAP reclaim, wick response, close strength, relative volume, and VWAP slope alignment support the same direction.
When these factors align, the score improves and the panel shifts toward a clearer action state.
📊 When to Use
• Intraday sessions where VWAP is actively watched
• Trend pullbacks around a volume-weighted mean
• Post-move reclaim attempts after sharp reactions
• Markets with enough liquidity for VWAP to be meaningful
• Breakout continuation and mean-reclaim review
⚠️ When NOT to Use
• Very low liquidity markets
• Extremely noisy symbols with unreliable volume
• Markets with wide spread or thin candles
• News-driven spikes where VWAP context can change too quickly
• Symbols where volume data is missing or distorted
🎛️ Key Inputs
• Anchor Mode → controls whether VWAP resets by session, week, or month.
• Pullback Pocket Depth → changes how wide the VWAP pullback area becomes.
• Reclaim Buffer → requires price to reclaim beyond VWAP by a volatility-adjusted amount.
• Invalidation Shelf → controls the risk shelf after reclaim.
• Minimum Ready Score → sets how strict READY labels should be.
• Target Rails → control the projected T1 and T2 reference levels.
• Label Settings → control density, size, spacing, and visual clarity.
• Panel Settings → control panel visibility, location, theme, and font size.
🖥️ Interface & Visual Design
The interface is designed to keep the chart readable while still feeling premium and informative.
The panel provides the current state at a glance. Labels mark important reclaim events. Zones and rails show context without overwhelming the candles.
The visual hierarchy is built around VWAP first, reclaim quality second, and action state third.
🧪 Practical Usage Workflow
1. Read the panel state.
2. Check whether price is near the VWAP pullback pocket.
3. Look for READY RECLAIM labels and score quality.
4. Compare price with the reclaim corridor, invalidation shelf, and target rails.
5. Confirm the broader market structure before making any decision.
🔍 Interpretation Guidelines
A high score means the reclaim structure is cleaner according to the script's rules.
A low or missing score means the reclaim context is incomplete, weak, or not currently active.
The script is best interpreted with trend, liquidity, volatility, and higher-timeframe structure.
🚫 What This Script Is NOT
This script is not a prediction engine.
It is not a financial advisor.
It is not an automated trading system.
It does not guarantee entries, exits, profits, or outcomes.
⚠️ Limitations & Transparency
VWAP behavior can differ across symbols, sessions, and timeframes.
Volume quality matters. If volume data is unreliable, VWAP interpretation may weaken.
Fast volatility expansion can invalidate reclaim context quickly.
No rule-based tool can fully account for market news, liquidity shocks, or sudden structural changes.
🧠 Market Context Notes
VWAP often acts as a live reference for institutional positioning, intraday fairness, and reaction quality.
However, VWAP should not be read alone. The best use comes from combining VWAP reclaim structure with liquidity, trend, volatility, and support/resistance context.
🧾 Use Case Examples
When price pulls below VWAP, rejects lower prices, and reclaims VWAP with strong close quality, the script may mark a bullish reclaim context.
When price pushes above VWAP, fails to hold, and reclaims downward with strong reaction quality, the script may mark a bearish reclaim context.
🧱 System Philosophy
VWAP Pullback Reclaim Planner follows the AG Pro Series approach: convert a market concept into a structured decision map with context, score, risk reference, and visual clarity.
The goal is not to replace judgment. The goal is to make judgment easier.
🔐 Non-Promise Statement
No script can provide certainty.
No signal should be treated as guaranteed.
Outputs should always be interpreted with independent analysis and risk control.
📉 Risk Disclosure
Trading involves risk.
Market conditions can change quickly.
Users are responsible for their own decisions, risk management, and trade execution.
This script is for educational and analytical purposes only and does not provide financial advice.
📚 Educational Note
This script is designed to help traders study how VWAP pullbacks, reclaim attempts, and reaction quality behave across different market conditions.
指標

Order Flow VWAP Deviation [LuxAlgo]The Order Flow VWAP Deviation indicator provides a comprehensive toolkit for analyzing market structure through volume-weighted price levels, liquidity zones, and order flow imbalances.
It combines classic VWAP standard deviation bands with dynamic stop-run detection and localized volume profiles to identify high-probability reversal and expansion zones.
🔶 USAGE
The tool is designed for intraday and swing traders who focus on liquidity "sweeps" and mean reversion. By plotting significant pivot highs and lows (Stop Zones) alongside VWAP bands, the indicator highlights areas where institutional liquidity is likely resting.
When price pierces these zones on high volume, the script flags a potential stop-run, signaling that a trend exhaustion or reversal may be imminent.
🔹 Stop Zones and Liquidity
The script tracks historical pivot points and extends them as dashed lines. When price crosses these lines with a volume surge (defined by the Stop Zone Volume Multiplier), it indicates that resting orders have been triggered.
These events are marked with circles on the chart to alert the trader to a shift in order flow.
🔹 Anchor Volume Profile
A specialized Volume Profile anchors to a specific time range (e.g., New York Open). This profile appears on the right side of the chart, highlighting the Point of Control (POC) in yellow and high-volume "Stop Nodes" in orange.
Each significant node displays a volume multiplier (e.g., 2.5x) and a buyer/seller bias (B/S) to show which side of the market is dominant at that price level.
🔹 Inversion Fair Value Gaps (IFVGs)
The indicator can optionally track Fair Value Gaps that have been "inverted." An IFVG occurs when a bearish gap is closed above or a bullish gap is closed below.
These act as refreshed support or resistance levels and are visualized as boxes on the chart until they are mitigated by price action.
🔶 DETAILS
The script utilizes a proxy for delta volume, calculating the bias based on the relationship between the close and the high/low of each bar within the profile calculation.
The Stop Zone logic uses a lookback period to ensure only significant structural pivots are considered, preventing chart clutter while focusing on major liquidity pools.
🔶 SETTINGS
VWAP Anchor: Determines the period for VWAP calculation (Session, Week, Month, or Year). Std. Dev Multiplier: Sets the distance for the upper and lower deviation bands. Pivot Lookback: The number of bars used to identify significant highs and lows for stop zones. Max Active Lines: Limits the number of horizontal liquidity levels displayed on the chart. Profile Rows: Adjusts the vertical granularity of the anchored Volume Profile. Anchor Time Range: Specifies the exact time (HHMM) used to start the volume collection for the profile. Stop Zone Volume Multiplier: Defines the threshold relative to average volume required to highlight a "Stop Node" in the profile. Show IFVGs: Toggles the visibility of Inversion Fair Value Gaps. IFVG Volatility Filter: A multiplier used to ensure only gaps formed by significant price moves are tracked. 指標

Triple Anchored VWAP [D/W/M]Triple Anchored VWAP
Institutional-grade volume-weighted average price analysis across three timeframes — all in one clean, customizable indicator.
This script plots three independently anchored VWAPs that reset at the start of each session, week, and month. Each VWAP acts as a dynamic fair-value level, showing where the average trader has been positioned over that period weighted by actual volume — making them far more meaningful than simple moving averages.
─── What's included ───
• Daily VWAP — resets every session, ideal for intraday and short-term traders
• Weekly VWAP — tracks fair value over the rolling week, great for swing setups
• Monthly VWAP — macro-level mean reversion and trend bias reference
Each VWAP includes:
→ 2 standard deviation bands (Band 1 and Band 2) with adjustable multipliers
→ Full color customization for the VWAP line and both deviation bands
→ Adjustable line width per timeframe
→ Toggle visibility of each VWAP and its bands independently
→ End-of-line labels (D-VWAP / W-VWAP / M-VWAP) so you always know what you're looking at
→ Source selection (HLC3, close, open, HL2, etc.)
─── Alerts ───
6 built-in alert conditions — price cross above and below each of the three VWAPs. Set them up in TradingView's Alerts menu and never miss a key level again.
─── How to use it ───
The deviation bands act as dynamic support and resistance. Price hugging the VWAP = balanced market. Price stretched toward Band 2 = extended, watch for reversion. A clean break and hold above the Weekly or Monthly VWAP often signals a shift in trend bias.
Works best on intraday charts (1m–4H) for the Daily VWAP, and daily/weekly charts for the Weekly and Monthly levels.
─── Settings ───
All three VWAPs are fully independent — toggle them on/off, adjust colors, band multipliers, line width, source, and labels separately. No clutter, just the levels you want.
Open-source and free for the community. Feedback and suggestions welcome. 指標

指標

指標

指標

指標

指標

指標

指標

指標