
Text me if you have any questions/comments for me.
-----
360
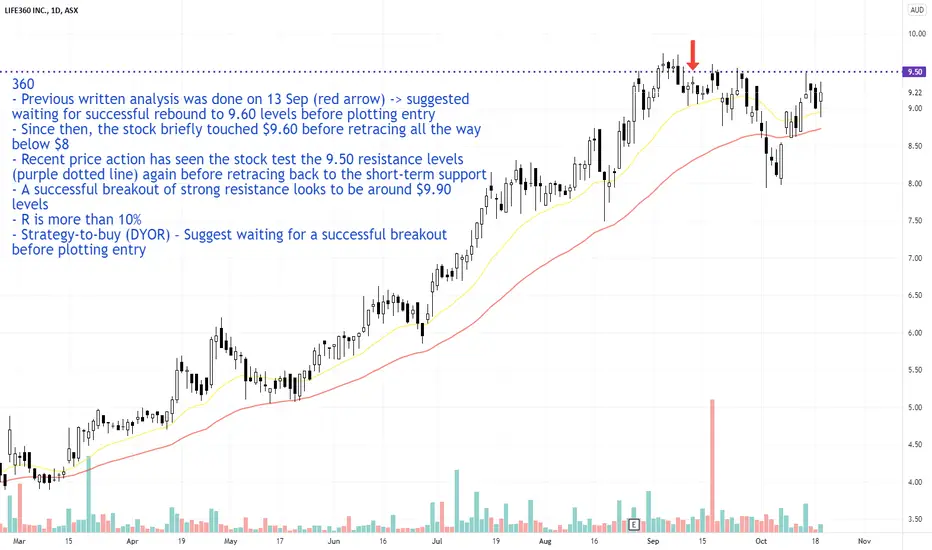
- Previous written analysis was done on 13 Sep (red arrow) -> suggested waiting for successful rebound to 9.60 levels before plotting entry
- Since then, the stock briefly touched $9.60 before retracing all the way below $8
- Recent price action has seen the stock test the 9.50 resistance levels (purple dotted line) again before retracing back to the short-term support
- A successful breakout of strong resistance looks to be around $9.90 levels
- R is more than 10%
- Strategy-to-buy (DYOR) – Suggest waiting for a successful breakout before plotting entry

Thông báo miễn trừ trách nhiệm
Thông tin và các ấn phẩm này không nhằm mục đích, và không cấu thành, lời khuyên hoặc khuyến nghị về tài chính, đầu tư, giao dịch hay các loại khác do TradingView cung cấp hoặc xác nhận. Đọc thêm tại Điều khoản Sử dụng.
Thông báo miễn trừ trách nhiệm
Thông tin và các ấn phẩm này không nhằm mục đích, và không cấu thành, lời khuyên hoặc khuyến nghị về tài chính, đầu tư, giao dịch hay các loại khác do TradingView cung cấp hoặc xác nhận. Đọc thêm tại Điều khoản Sử dụng.