
Hi everyone,
Lets look at AAPL weekly charts
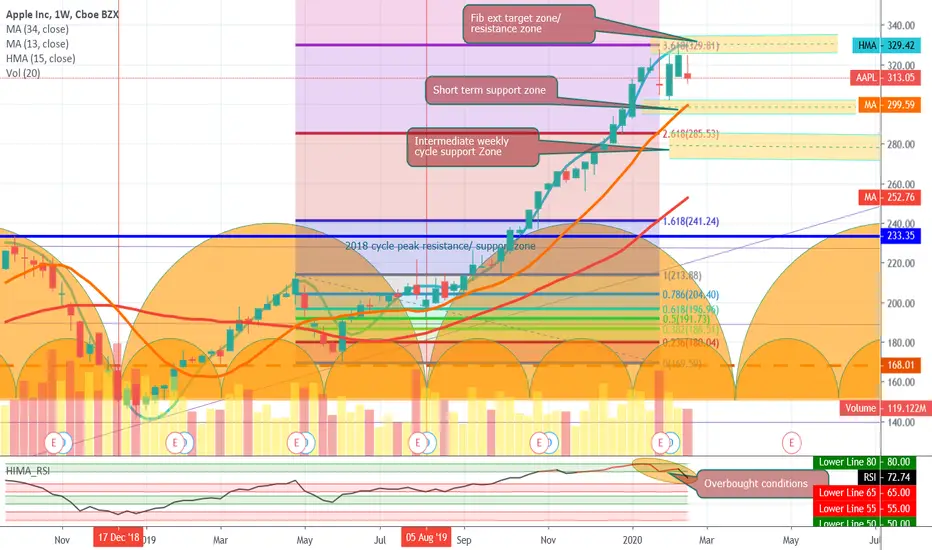
While stock remains bullish, I think its set for a pullback, which I think is actually good for the stock too. It has had a massive run up and has bulldozed over all the expected the resistance zones on weekly charts.
At this stage we see the following prevailing conditions
1. RSI dipping from overbought conditions, interesting to look where it finds support
2. The Major dominant and minor cycles both expected to bottom, having more impact on price movement , supporting my expectation of pullback
3. Short term support near $ 300 levels
4. Intermediate support near $270 to $290
5. We are near expected weekly cycle target range with low expectations of excessive higher levels being sustainable
I would wait for the cycle pullback to happen and await the beginning of the new cycle to revisit the chart and market conditions and go long!
If you like what you see, please share a thumbs up and follow me for more updates
Lets look at AAPL weekly charts
While stock remains bullish, I think its set for a pullback, which I think is actually good for the stock too. It has had a massive run up and has bulldozed over all the expected the resistance zones on weekly charts.
At this stage we see the following prevailing conditions
1. RSI dipping from overbought conditions, interesting to look where it finds support
2. The Major dominant and minor cycles both expected to bottom, having more impact on price movement , supporting my expectation of pullback
3. Short term support near $ 300 levels
4. Intermediate support near $270 to $290
5. We are near expected weekly cycle target range with low expectations of excessive higher levels being sustainable
I would wait for the cycle pullback to happen and await the beginning of the new cycle to revisit the chart and market conditions and go long!
If you like what you see, please share a thumbs up and follow me for more updates

If you love what you see, pls share a thumbs up and a comment in the section below
Thông báo miễn trừ trách nhiệm
Thông tin và các ấn phẩm này không nhằm mục đích, và không cấu thành, lời khuyên hoặc khuyến nghị về tài chính, đầu tư, giao dịch hay các loại khác do TradingView cung cấp hoặc xác nhận. Đọc thêm tại Điều khoản Sử dụng.
If you love what you see, pls share a thumbs up and a comment in the section below
Thông báo miễn trừ trách nhiệm
Thông tin và các ấn phẩm này không nhằm mục đích, và không cấu thành, lời khuyên hoặc khuyến nghị về tài chính, đầu tư, giao dịch hay các loại khác do TradingView cung cấp hoặc xác nhận. Đọc thêm tại Điều khoản Sử dụng.