
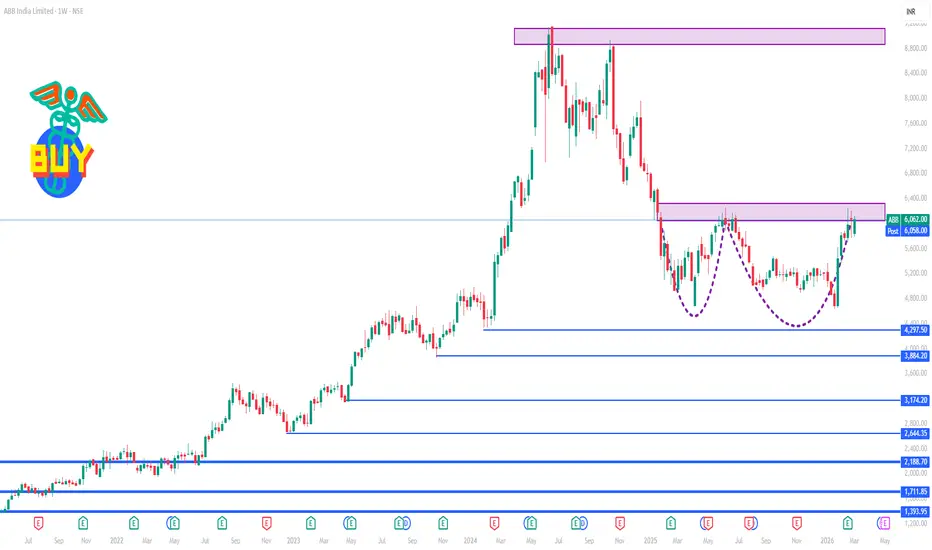
📈 Current Price (Live / Most Recent)
• Latest NSE price: ~₹6,060 – ₹6,080 per share.
This gives us the reference point for weekly levels below.
📊 1‑Week Key Levels
🔼 Upward (Resistance) Levels
These are zones where the stock may face selling pressure or pause going higher:
R1: ₹6,080 – ₹6,110 — immediate resistance (near current price cluster).
R2: ₹6,200 – ₹6,260 — zone around the recent 52‑week high range (~₹6,260).
R3: ~₹6,300 – ₹6,350+ — higher leg resistance before broader breakout level.
📌 Bullish scenario: Sustained weekly closes above ₹6,260 may indicate continuation toward higher levels, potentially ₹6,300+.
🔽 Downward (Support) Levels
These are zones where the stock may find buying support or stop falling:
S1: ₹5,900 – ₹5,930 — near current short‑term pivot zone and weekly support.
S2: ₹5,780 – ₹5,820 — next support seen from recent pivot calculation.
S3: ₹5,650 – ₹5,600 — deeper support if the weekly break happens.
📌 Bearish scenario: A weekly close below ~₹5,900 could see a further test toward ₹5,780 or lower zones.
🔁 Pivot / Mid‑Point
• Weekly Pivot: Around ~₹5,920 – ₹5,950 (central decision zone).
This pivot helps gauge whether bulls or bears are controlling short‑term direction:
Price staying above this pivot → bullish bias
Price below pivot → bearish bias
⭐ Quick Weekly Interpretation
📈 Bullish bias if:
Price holds above ₹6,080 & breaks above ₹6,200 on weekly close.
This signals strength and may target ₹6,300+.
📉 Bearish bias if:
Price loses ₹5,900 convincingly (weekly close).
Then focus shifts to ₹5,780 and eventually ₹5,650.
• Latest NSE price: ~₹6,060 – ₹6,080 per share.
This gives us the reference point for weekly levels below.
📊 1‑Week Key Levels
🔼 Upward (Resistance) Levels
These are zones where the stock may face selling pressure or pause going higher:
R1: ₹6,080 – ₹6,110 — immediate resistance (near current price cluster).
R2: ₹6,200 – ₹6,260 — zone around the recent 52‑week high range (~₹6,260).
R3: ~₹6,300 – ₹6,350+ — higher leg resistance before broader breakout level.
📌 Bullish scenario: Sustained weekly closes above ₹6,260 may indicate continuation toward higher levels, potentially ₹6,300+.
🔽 Downward (Support) Levels
These are zones where the stock may find buying support or stop falling:
S1: ₹5,900 – ₹5,930 — near current short‑term pivot zone and weekly support.
S2: ₹5,780 – ₹5,820 — next support seen from recent pivot calculation.
S3: ₹5,650 – ₹5,600 — deeper support if the weekly break happens.
📌 Bearish scenario: A weekly close below ~₹5,900 could see a further test toward ₹5,780 or lower zones.
🔁 Pivot / Mid‑Point
• Weekly Pivot: Around ~₹5,920 – ₹5,950 (central decision zone).
This pivot helps gauge whether bulls or bears are controlling short‑term direction:
Price staying above this pivot → bullish bias
Price below pivot → bearish bias
⭐ Quick Weekly Interpretation
📈 Bullish bias if:
Price holds above ₹6,080 & breaks above ₹6,200 on weekly close.
This signals strength and may target ₹6,300+.
📉 Bearish bias if:
Price loses ₹5,900 convincingly (weekly close).
Then focus shifts to ₹5,780 and eventually ₹5,650.

Contact Knowledgehub for a detailed consultation: Dm on WhatsApp: [wa.link/a2o0kz]-
Phone No: [+91 93102 26243]-
Email: [tradingviewknowledgehub@gmail.com]---
-- Let’s achieve success together!
Phone No: [+91 93102 26243]-
Email: [tradingviewknowledgehub@gmail.com]---
-- Let’s achieve success together!
Bài đăng liên quan
Thông báo miễn trừ trách nhiệm
Thông tin và các ấn phẩm này không nhằm mục đích, và không cấu thành, lời khuyên hoặc khuyến nghị về tài chính, đầu tư, giao dịch hay các loại khác do TradingView cung cấp hoặc xác nhận. Đọc thêm tại Điều khoản Sử dụng.
Contact Knowledgehub for a detailed consultation: Dm on WhatsApp: [wa.link/a2o0kz]-
Phone No: [+91 93102 26243]-
Email: [tradingviewknowledgehub@gmail.com]---
-- Let’s achieve success together!
Phone No: [+91 93102 26243]-
Email: [tradingviewknowledgehub@gmail.com]---
-- Let’s achieve success together!
Bài đăng liên quan
Thông báo miễn trừ trách nhiệm
Thông tin và các ấn phẩm này không nhằm mục đích, và không cấu thành, lời khuyên hoặc khuyến nghị về tài chính, đầu tư, giao dịch hay các loại khác do TradingView cung cấp hoặc xác nhận. Đọc thêm tại Điều khoản Sử dụng.