
📈 1-Month Key Price Range
🔹 1-Month High: ~₹1,779 (late Jan 2026)
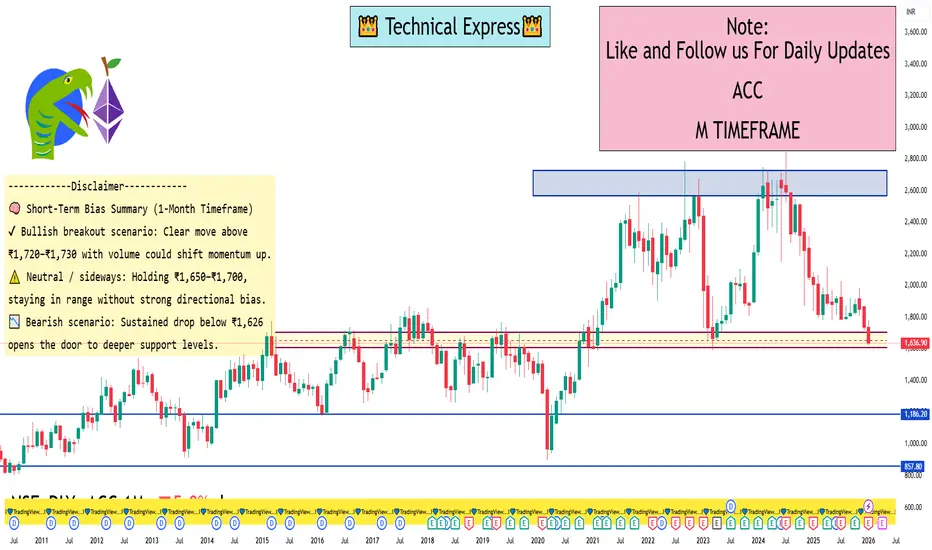
🔹 1-Month Low: ~₹1,626 (recent session low)
➡️ So the current 1-month trading range is roughly:
👉 ₹1,626 – ₹1,779
🔥 Short-Term Support & Resistance Levels
Support (Downside)
• S1: ~₹1,626 — recent intra-day low and current 52-week low area.
• S2: ~₹1,600 — psychological/support near multi-session lows (below recent range).
• S3: ~₹1,570 … deeper support if the range breaks down.
Resistance (Upside)
• R1: ~₹1,670–₹1,680 — immediate resistance around recent price reaction zone.
• R2: ~₹1,720 — short-term resistance near 20–30 day moving averages.
• R3: ~₹1,760–₹1,780 — recent 1-month highs.
📊 1-Month Technical Context
📉 Over the past 30 days, ACC has been in a modest downtrend/weak range, with 1-month returns in negative territory and prices sliding from the upper ₹1,700s toward mid-₹1,600s.
Technical indicators also point toward bearish/neutral momentum in the short term (e.g., RSI weak, MACD bearish) — aligning with the recent price pressures.
🔹 1-Month High: ~₹1,779 (late Jan 2026)
🔹 1-Month Low: ~₹1,626 (recent session low)
➡️ So the current 1-month trading range is roughly:
👉 ₹1,626 – ₹1,779
🔥 Short-Term Support & Resistance Levels
Support (Downside)
• S1: ~₹1,626 — recent intra-day low and current 52-week low area.
• S2: ~₹1,600 — psychological/support near multi-session lows (below recent range).
• S3: ~₹1,570 … deeper support if the range breaks down.
Resistance (Upside)
• R1: ~₹1,670–₹1,680 — immediate resistance around recent price reaction zone.
• R2: ~₹1,720 — short-term resistance near 20–30 day moving averages.
• R3: ~₹1,760–₹1,780 — recent 1-month highs.
📊 1-Month Technical Context
📉 Over the past 30 days, ACC has been in a modest downtrend/weak range, with 1-month returns in negative territory and prices sliding from the upper ₹1,700s toward mid-₹1,600s.
Technical indicators also point toward bearish/neutral momentum in the short term (e.g., RSI weak, MACD bearish) — aligning with the recent price pressures.

Bài đăng liên quan
Thông báo miễn trừ trách nhiệm
Thông tin và các ấn phẩm này không nhằm mục đích, và không cấu thành, lời khuyên hoặc khuyến nghị về tài chính, đầu tư, giao dịch hay các loại khác do TradingView cung cấp hoặc xác nhận. Đọc thêm tại Điều khoản Sử dụng.
Bài đăng liên quan
Thông báo miễn trừ trách nhiệm
Thông tin và các ấn phẩm này không nhằm mục đích, và không cấu thành, lời khuyên hoặc khuyến nghị về tài chính, đầu tư, giao dịch hay các loại khác do TradingView cung cấp hoặc xác nhận. Đọc thêm tại Điều khoản Sử dụng.