Giá xuống
AE/BTC 1D
Hello friends
We are here AE/BTC charts see
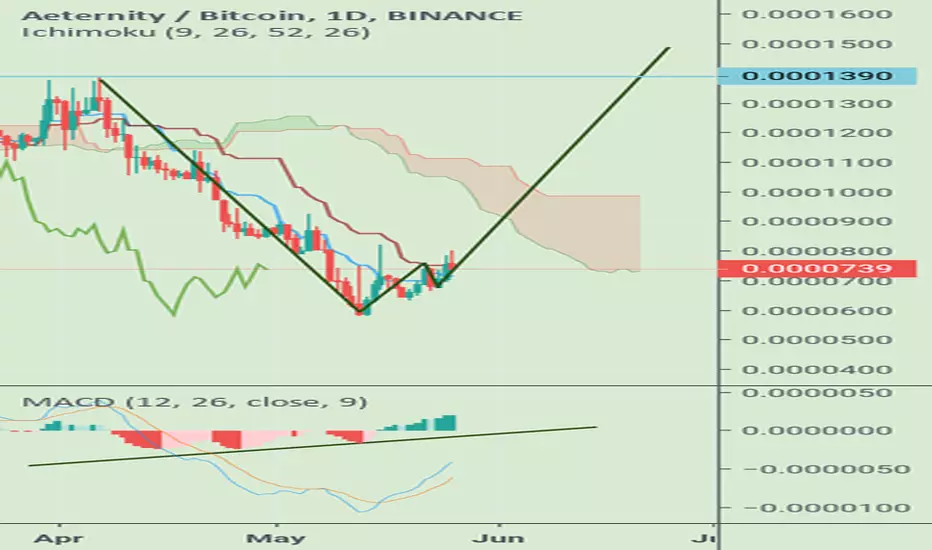
1.In the daily chart after 49 days opens candel top of the "Tenkan sen" line on ichimuko indicator ; this means the break resistance short term
2.buliesh divergens in macd indicator
3.nice double bottom pattern in this chart
So i think in short time we see 1500sat but in 1390sat area we have big resistance
I hope this analysis be useful to you. Definitely a financial advice is not

Thông báo miễn trừ trách nhiệm
Thông tin và các ấn phẩm này không nhằm mục đích, và không cấu thành, lời khuyên hoặc khuyến nghị về tài chính, đầu tư, giao dịch hay các loại khác do TradingView cung cấp hoặc xác nhận. Đọc thêm tại Điều khoản Sử dụng.
Thông báo miễn trừ trách nhiệm
Thông tin và các ấn phẩm này không nhằm mục đích, và không cấu thành, lời khuyên hoặc khuyến nghị về tài chính, đầu tư, giao dịch hay các loại khác do TradingView cung cấp hoặc xác nhận. Đọc thêm tại Điều khoản Sử dụng.