
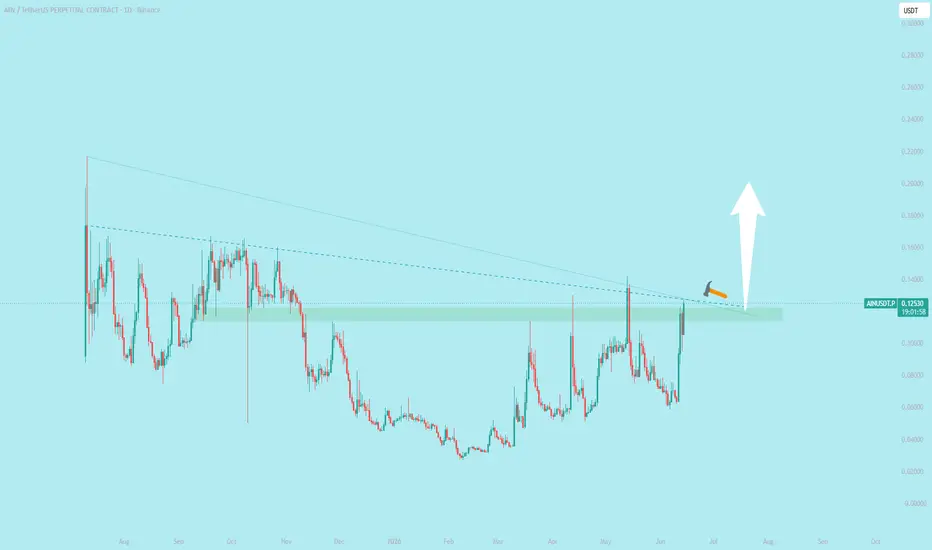
📊 Possible Patterns
- **Falling Wedge (Bullish Reversal)**
- The descending trendline combined with higher lows suggests a wedge formation.
- Price is pressing against the upper boundary, and a breakout above resistance would confirm the wedge pattern.
- Target projection: height of wedge added to breakout point → could push toward **0.14–0.15**.
- **Double Bottom (Reversal)**
- Around the **0.105–0.106** zone, price tested support twice before bouncing.
- This creates a potential double bottom structure, which is bullish if neckline (0.125–0.127) breaks.
- Measured move target: ~0.145.
- **Bullish Hammer Candlestick**
- The recent candle resembles a hammer at the trendline, signaling rejection of lower prices and possible reversal momentum.
---
⚠️ What to Watch
- **Confirmation:** Patterns only matter if confirmed by breakout and volume.
- **Neckline Break:** For the double bottom, a daily close above **0.127** is key.
- **Retest:** Often, price retests the breakout zone before continuing higher.
---
👉 In summary: The chart shows a **falling wedge** and a **double bottom** forming at support. Both are bullish reversal patterns, but confirmation requires a strong breakout above resistance with volume.

Thông báo miễn trừ trách nhiệm
Thông tin và các ấn phẩm này không nhằm mục đích, và không cấu thành, lời khuyên hoặc khuyến nghị về tài chính, đầu tư, giao dịch hay các loại khác do TradingView cung cấp hoặc xác nhận. Đọc thêm tại Điều khoản Sử dụng.
Thông báo miễn trừ trách nhiệm
Thông tin và các ấn phẩm này không nhằm mục đích, và không cấu thành, lời khuyên hoặc khuyến nghị về tài chính, đầu tư, giao dịch hay các loại khác do TradingView cung cấp hoặc xác nhận. Đọc thêm tại Điều khoản Sử dụng.