
It might become doubtful, with every single day that isn't one full big green candle, doubt can creep in.
Look at Bitcoin, after months of consolidation it breaks bullish yet, each time we don't see prices going straight up we doubt thinking, "Is this the end or will it continue going?"
Bitcoin Cash went through the same pattern, it hit a lower low this month compared to December 2022 and look how great it is doing.
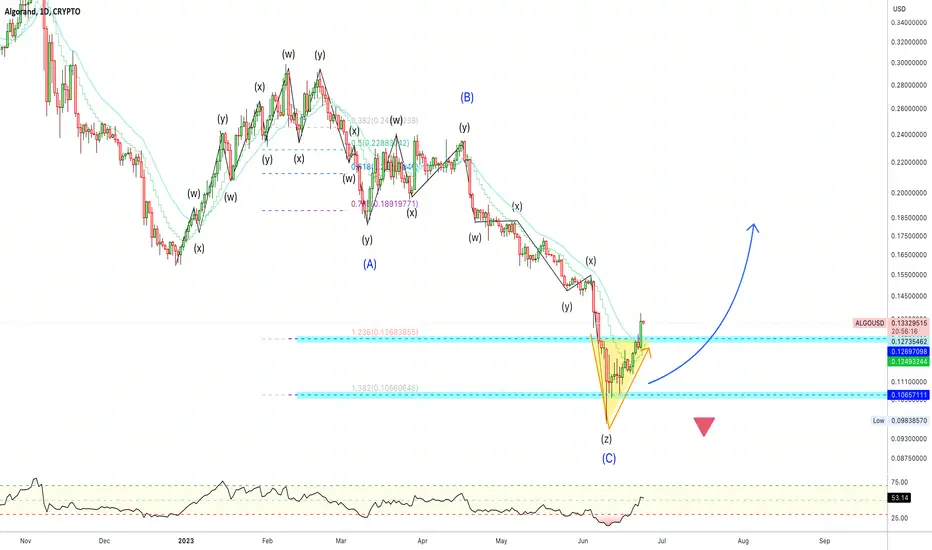
ALGOUSD went through a full correction, the RSI went to the extreme on the downside and is now recovering hitting above 50.
When the RSI is above 50 yet prices are low, it comes as one of the best signals to support a reversal taking place.
The next one would be volume but we have no volume on these charts and volume can be tricky.
Prices can be seen rising and the volume be low but only because there is no resistance and volume appears only when selling pressure shows up and is eliminated.
ALGOUSD is now trading above EMA10 and EMA21 with a strong bullish bias.
The support levels are marked blue on the chart. Below these levels, the bullish potential weakens. Any trading above these levels and the bullish perspective stays active, valid and strong.
Namaste.
Look at Bitcoin, after months of consolidation it breaks bullish yet, each time we don't see prices going straight up we doubt thinking, "Is this the end or will it continue going?"
Bitcoin Cash went through the same pattern, it hit a lower low this month compared to December 2022 and look how great it is doing.
ALGOUSD went through a full correction, the RSI went to the extreme on the downside and is now recovering hitting above 50.
When the RSI is above 50 yet prices are low, it comes as one of the best signals to support a reversal taking place.
The next one would be volume but we have no volume on these charts and volume can be tricky.
Prices can be seen rising and the volume be low but only because there is no resistance and volume appears only when selling pressure shows up and is eliminated.
ALGOUSD is now trading above EMA10 and EMA21 with a strong bullish bias.
The support levels are marked blue on the chart. Below these levels, the bullish potential weakens. Any trading above these levels and the bullish perspective stays active, valid and strong.
Namaste.

🔥 Get the FULL (4-in-1) PREMIUM PACKAGE 👇
t.me/lamatrades/4 (Since 2017)
✅ FREE PREMIUM trade-numbers (4-10X) 👇
t.me/masteranandatrades/9043
🚨 TOP Results May 2026 👇
t.me/masteranandatrades/8778
t.me/lamatrades/4 (Since 2017)
✅ FREE PREMIUM trade-numbers (4-10X) 👇
t.me/masteranandatrades/9043
🚨 TOP Results May 2026 👇
t.me/masteranandatrades/8778
Thông báo miễn trừ trách nhiệm
Thông tin và các ấn phẩm này không nhằm mục đích, và không cấu thành, lời khuyên hoặc khuyến nghị về tài chính, đầu tư, giao dịch hay các loại khác do TradingView cung cấp hoặc xác nhận. Đọc thêm tại Điều khoản Sử dụng.
🔥 Get the FULL (4-in-1) PREMIUM PACKAGE 👇
t.me/lamatrades/4 (Since 2017)
✅ FREE PREMIUM trade-numbers (4-10X) 👇
t.me/masteranandatrades/9043
🚨 TOP Results May 2026 👇
t.me/masteranandatrades/8778
t.me/lamatrades/4 (Since 2017)
✅ FREE PREMIUM trade-numbers (4-10X) 👇
t.me/masteranandatrades/9043
🚨 TOP Results May 2026 👇
t.me/masteranandatrades/8778
Thông báo miễn trừ trách nhiệm
Thông tin và các ấn phẩm này không nhằm mục đích, và không cấu thành, lời khuyên hoặc khuyến nghị về tài chính, đầu tư, giao dịch hay các loại khác do TradingView cung cấp hoặc xác nhận. Đọc thêm tại Điều khoản Sử dụng.