
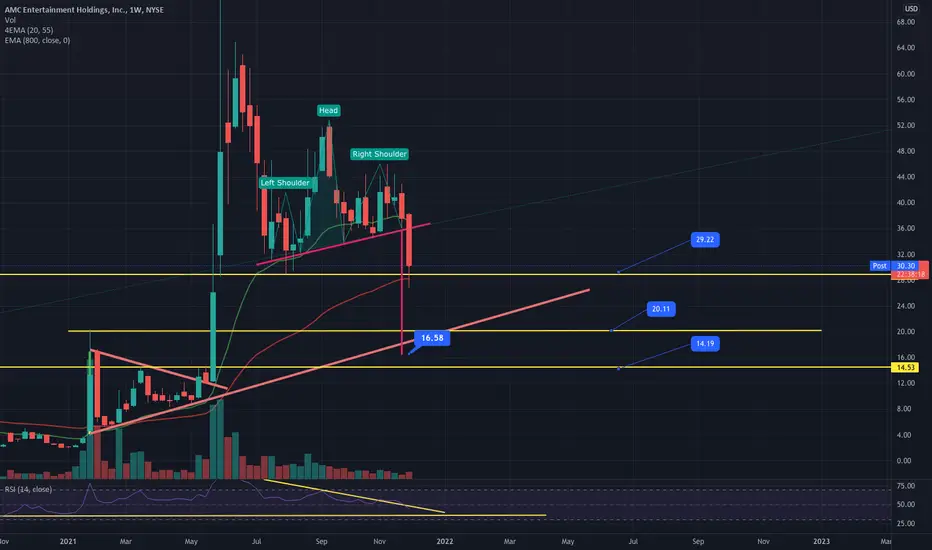
We can now see a clear head and shoulders pattern executed on the weekly time frame. The stock has bounced slightly off the 55 weekly moving average currently finding support at around $29 which was the previous swing low from August. The technical target from the head and shoulders pattern would bring the price to around $16.
Levels of support :
If we fail to hold support at $29 and lose the weekly 55 moving average we have $20 which is a previous swing high as labeled (top of previous pendant wick) and $14.33 ( previous swing high from first pendant.
Levels of support :
If we fail to hold support at $29 and lose the weekly 55 moving average we have $20 which is a previous swing high as labeled (top of previous pendant wick) and $14.33 ( previous swing high from first pendant.

Thông báo miễn trừ trách nhiệm
Thông tin và các ấn phẩm này không nhằm mục đích, và không cấu thành, lời khuyên hoặc khuyến nghị về tài chính, đầu tư, giao dịch hay các loại khác do TradingView cung cấp hoặc xác nhận. Đọc thêm tại Điều khoản Sử dụng.
Thông báo miễn trừ trách nhiệm
Thông tin và các ấn phẩm này không nhằm mục đích, và không cấu thành, lời khuyên hoặc khuyến nghị về tài chính, đầu tư, giao dịch hay các loại khác do TradingView cung cấp hoặc xác nhận. Đọc thêm tại Điều khoản Sử dụng.