
Is a Rally Brewing? Technicals Signal Bullish Sentiment for AMD
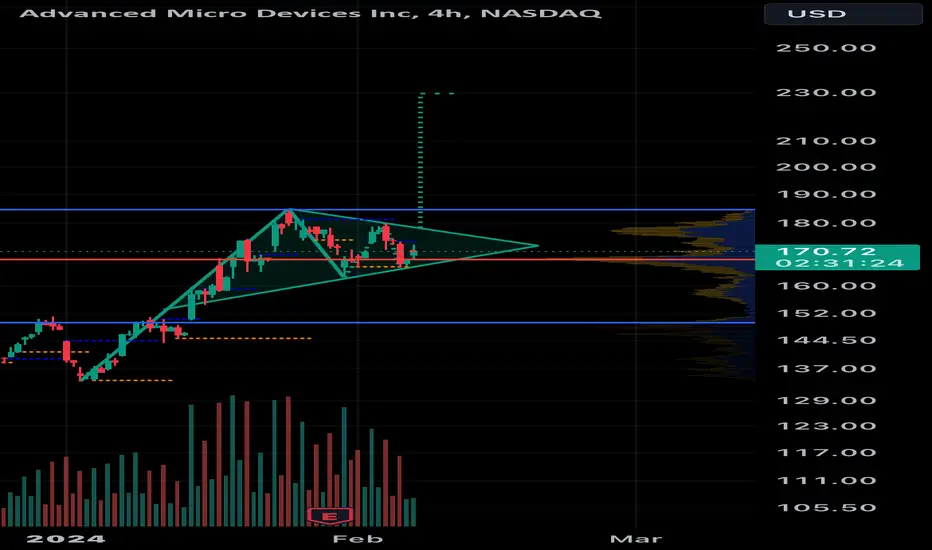
AMD Chart Analysis: Potential Bullish Signal on 4-Hour Timeframe
I've observed a potential bullish pennant pattern forming on the 4-hour chart for AMD. This pattern often precedes price breakouts, with a target of $230 based on standard technical analysis measurements. However, it's crucial to remember:
Technical analysis is not a guarantee of future results: Past performance doesn't predict future outcomes. Consider this pattern as a possibility, not a certainty.
Thorough research is essential: Conduct your own research, analyze fundamental factors, and understand the inherent risks involved before making any investment decisions.
Risk management is paramount: Always prioritize risk management strategies like stop-loss orders, regardless of technical signals or price targets.
I've observed a potential bullish pennant pattern forming on the 4-hour chart for AMD. This pattern often precedes price breakouts, with a target of $230 based on standard technical analysis measurements. However, it's crucial to remember:
Technical analysis is not a guarantee of future results: Past performance doesn't predict future outcomes. Consider this pattern as a possibility, not a certainty.
Thorough research is essential: Conduct your own research, analyze fundamental factors, and understand the inherent risks involved before making any investment decisions.
Risk management is paramount: Always prioritize risk management strategies like stop-loss orders, regardless of technical signals or price targets.
Giao dịch đang hoạt động
Giao dịch đang hoạt động

USDT: 0xd3787d843Cf915E5475119459B34b6429827c297
Thông báo miễn trừ trách nhiệm
Thông tin và các ấn phẩm này không nhằm mục đích, và không cấu thành, lời khuyên hoặc khuyến nghị về tài chính, đầu tư, giao dịch hay các loại khác do TradingView cung cấp hoặc xác nhận. Đọc thêm tại Điều khoản Sử dụng.
USDT: 0xd3787d843Cf915E5475119459B34b6429827c297
Thông báo miễn trừ trách nhiệm
Thông tin và các ấn phẩm này không nhằm mục đích, và không cấu thành, lời khuyên hoặc khuyến nghị về tài chính, đầu tư, giao dịch hay các loại khác do TradingView cung cấp hoặc xác nhận. Đọc thêm tại Điều khoản Sử dụng.