
Long Term Story:
📈 The Setup
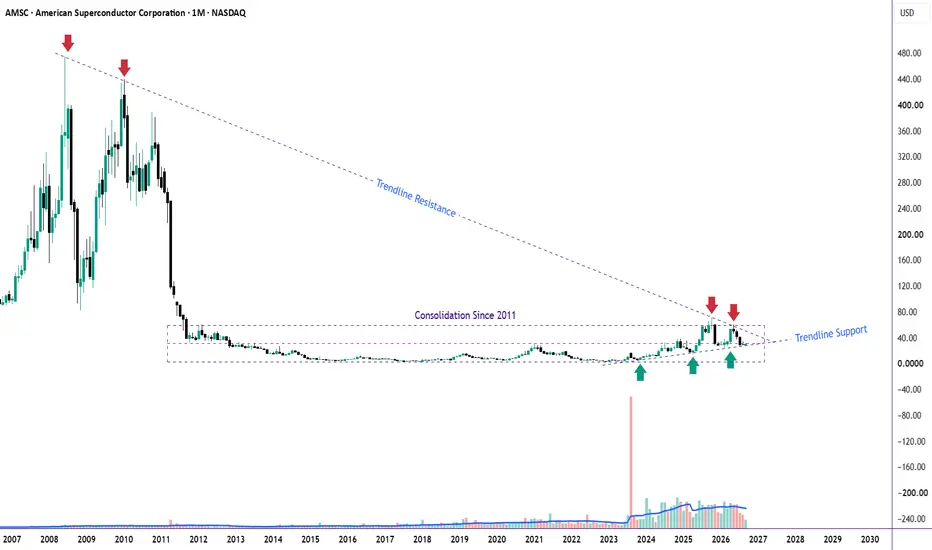
American Superconductor peaked at ~$480 in 2008, made a lower high near $440 in 2010 (double-top distribution 🔻🔻), then collapsed over 95% into a dead, 13-year sideways base that most traders forgot existed.
🔋 The Wake-Up
Since 2023, volume has come back to life for the first time in over a decade 📊, and price has been grinding higher off that long base — something this stock hasn't done since the bubble years.
⚠️ The Squeeze
Here's the real story: the descending trendline connecting the 2008 and 2010 highs is now converging with the top of the 2011-2026 consolidation range. Two attempts to break through (🔻 marked on the chart) have already failed. The gap between falling trendline resistance and the range ceiling is shrinking — a coil that's been over a decade in the making.
👀 Levels to Watch
🔺 Resistance / breakout trigger: the trendline + range-top confluence zone (confirm exact value on the chart — it's tightening month to month as the trendline descends)
🔻 Structure support: the recent higher-low base built since 2023-2024
✅ Confirmation: a monthly close above the confluence zone, ideally on expanding volume
❌ Invalidation: a third rejection here keeps this a 15+ year range, not a breakout
🧠 Why it matters: A clean break above this level would be the first time since the 2008 bubble that AMSC has closed above the trendline that capped every major top since. That's not a minor technical event for a stock this dormant.
I will be posting a closeup weekly view, why I think AMSC is going to make another breakout attempt.
📈 The Setup
American Superconductor peaked at ~$480 in 2008, made a lower high near $440 in 2010 (double-top distribution 🔻🔻), then collapsed over 95% into a dead, 13-year sideways base that most traders forgot existed.
🔋 The Wake-Up
Since 2023, volume has come back to life for the first time in over a decade 📊, and price has been grinding higher off that long base — something this stock hasn't done since the bubble years.
⚠️ The Squeeze
Here's the real story: the descending trendline connecting the 2008 and 2010 highs is now converging with the top of the 2011-2026 consolidation range. Two attempts to break through (🔻 marked on the chart) have already failed. The gap between falling trendline resistance and the range ceiling is shrinking — a coil that's been over a decade in the making.
👀 Levels to Watch
🔺 Resistance / breakout trigger: the trendline + range-top confluence zone (confirm exact value on the chart — it's tightening month to month as the trendline descends)
🔻 Structure support: the recent higher-low base built since 2023-2024
✅ Confirmation: a monthly close above the confluence zone, ideally on expanding volume
❌ Invalidation: a third rejection here keeps this a 15+ year range, not a breakout
🧠 Why it matters: A clean break above this level would be the first time since the 2008 bubble that AMSC has closed above the trendline that capped every major top since. That's not a minor technical event for a stock this dormant.
I will be posting a closeup weekly view, why I think AMSC is going to make another breakout attempt.

📊 Charts → 🏗️ Structure → 🎯 Probability =📖 Chart Story
⏳ Patience → 🚀Success
🎯 If this setup makes sense to you, show it some support with a Boost.
⏳ Patience → 🚀Success
🎯 If this setup makes sense to you, show it some support with a Boost.
Thông báo miễn trừ trách nhiệm
Thông tin và các ấn phẩm này không nhằm mục đích, và không cấu thành, lời khuyên hoặc khuyến nghị về tài chính, đầu tư, giao dịch hay các loại khác do TradingView cung cấp hoặc xác nhận. Đọc thêm tại Điều khoản Sử dụng.
📊 Charts → 🏗️ Structure → 🎯 Probability =📖 Chart Story
⏳ Patience → 🚀Success
🎯 If this setup makes sense to you, show it some support with a Boost.
⏳ Patience → 🚀Success
🎯 If this setup makes sense to you, show it some support with a Boost.
Thông báo miễn trừ trách nhiệm
Thông tin và các ấn phẩm này không nhằm mục đích, và không cấu thành, lời khuyên hoặc khuyến nghị về tài chính, đầu tư, giao dịch hay các loại khác do TradingView cung cấp hoặc xác nhận. Đọc thêm tại Điều khoản Sử dụng.