
Hello Traders,
welcome to this free and educational multi-timeframe technical analysis .
On the weekly timeframe you can see that Amazon stock is currently breaking above a major previous weekly structure area exactly at the $105 level which is now turned support.
You can also see that over the past months, Amazon has been creating a solid double bottom, weekly market structure and moving averages are also very bullish, so I am now just waiting for a retracement and then I do expect more continuation towards the upside.
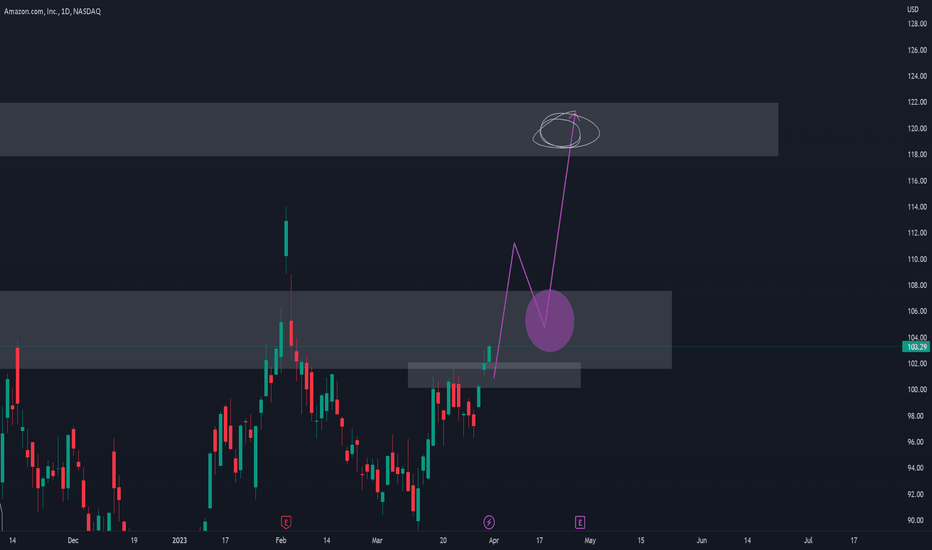
On the daily timeframe you can see that with today's candle, Amazon stock is perfectly breaking above a major previous daily resistance area at the $112 level which is now turned support so I am now just waiting for a retest and then I am looking to get long on Amazon.
Thank you for watching and I will see you tomorrow!
You can also check out my previous analysis of this asset:
welcome to this free and educational multi-timeframe technical analysis .
On the weekly timeframe you can see that Amazon stock is currently breaking above a major previous weekly structure area exactly at the $105 level which is now turned support.
You can also see that over the past months, Amazon has been creating a solid double bottom, weekly market structure and moving averages are also very bullish, so I am now just waiting for a retracement and then I do expect more continuation towards the upside.
On the daily timeframe you can see that with today's candle, Amazon stock is perfectly breaking above a major previous daily resistance area at the $112 level which is now turned support so I am now just waiting for a retest and then I am looking to get long on Amazon.
Thank you for watching and I will see you tomorrow!
You can also check out my previous analysis of this asset:

#1 Video Author on @TradingView 🏆
Swing Trader since the Year 2019 💻
Daily Analysis from Monday - Friday 💰
4K+ Traders in Our FREE Community👇
discord.gg/jgdrYXwqyD
Swing Trader since the Year 2019 💻
Daily Analysis from Monday - Friday 💰
4K+ Traders in Our FREE Community👇
discord.gg/jgdrYXwqyD
Thông báo miễn trừ trách nhiệm
Thông tin và các ấn phẩm này không nhằm mục đích, và không cấu thành, lời khuyên hoặc khuyến nghị về tài chính, đầu tư, giao dịch hay các loại khác do TradingView cung cấp hoặc xác nhận. Đọc thêm tại Điều khoản Sử dụng.