
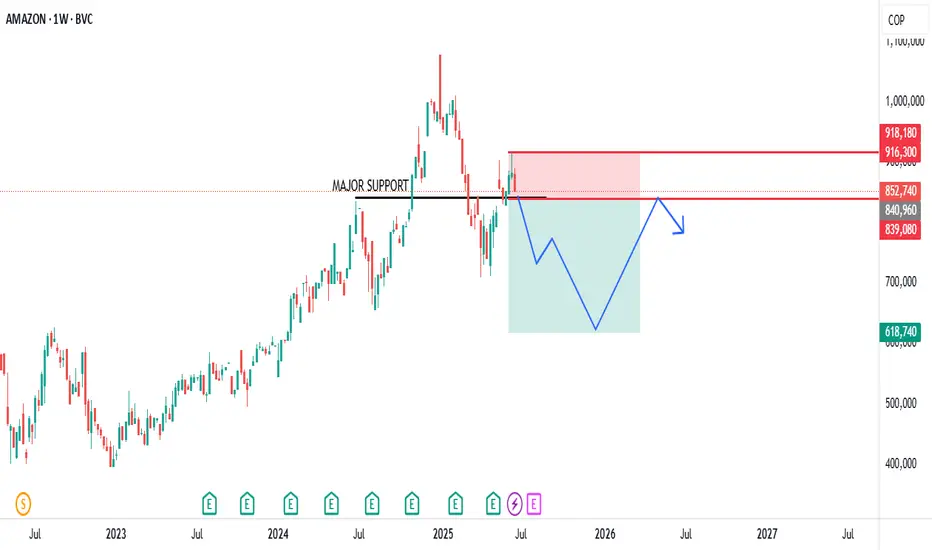
The chart depicts the weekly price movement of Amazon (AMZN) stock from 2022 to mid-2025, with a focus on a recent period around June 2025. Here’s an analysis based on the provided chart:
Historical Trend: The stock experienced a significant upward trend from 2022 to mid-2024, showing consistent growth with periodic corrections. This suggests strong bullish momentum over the long term.
Major Support Level: A key support zone is identified around the $916.18 to $919.18 range (highlighted in red). The price recently approached this level and appears to have found support, as indicated by the stabilization and slight upward movement after testing this zone.
Recent Price Action: After reaching a peak near $1,000, the stock experienced a sharp decline, entering a consolidation phase within a descending triangle pattern (highlighted in light blue). The price recently broke below the lower trendline of this pattern, suggesting potential bearish momentum.
Projected Movement: The chart includes a downward projection (blue arrow) indicating a possible further decline toward the $616.74 to $650.00 range if the bearish trend continues. This could represent a deeper correction or a test of a lower support level.
Volume and Indicators: The chart shows Bollinger Bands (BVC 880,260 H90,000 L85,200) and a closing price of $852,740 with a -29,380 (-3.33%) change, indicating increased volatility and a recent downward shift. However, specific volume or momentum indicators are not detailed enough for a precise assessment.
Outlook: The stock is currently at a critical juncture. If the $916.18 support holds, it may signal a reversal or consolidation. A break below this level could lead to a more significant decline toward the projected $616.74-$650.00 range. Monitoring price action around the support zone will be key.
Historical Trend: The stock experienced a significant upward trend from 2022 to mid-2024, showing consistent growth with periodic corrections. This suggests strong bullish momentum over the long term.
Major Support Level: A key support zone is identified around the $916.18 to $919.18 range (highlighted in red). The price recently approached this level and appears to have found support, as indicated by the stabilization and slight upward movement after testing this zone.
Recent Price Action: After reaching a peak near $1,000, the stock experienced a sharp decline, entering a consolidation phase within a descending triangle pattern (highlighted in light blue). The price recently broke below the lower trendline of this pattern, suggesting potential bearish momentum.
Projected Movement: The chart includes a downward projection (blue arrow) indicating a possible further decline toward the $616.74 to $650.00 range if the bearish trend continues. This could represent a deeper correction or a test of a lower support level.
Volume and Indicators: The chart shows Bollinger Bands (BVC 880,260 H90,000 L85,200) and a closing price of $852,740 with a -29,380 (-3.33%) change, indicating increased volatility and a recent downward shift. However, specific volume or momentum indicators are not detailed enough for a precise assessment.
Outlook: The stock is currently at a critical juncture. If the $916.18 support holds, it may signal a reversal or consolidation. A break below this level could lead to a more significant decline toward the projected $616.74-$650.00 range. Monitoring price action around the support zone will be key.

Thông báo miễn trừ trách nhiệm
Thông tin và các ấn phẩm này không nhằm mục đích, và không cấu thành, lời khuyên hoặc khuyến nghị về tài chính, đầu tư, giao dịch hay các loại khác do TradingView cung cấp hoặc xác nhận. Đọc thêm tại Điều khoản Sử dụng.
Thông báo miễn trừ trách nhiệm
Thông tin và các ấn phẩm này không nhằm mục đích, và không cấu thành, lời khuyên hoặc khuyến nghị về tài chính, đầu tư, giao dịch hay các loại khác do TradingView cung cấp hoặc xác nhận. Đọc thêm tại Điều khoản Sử dụng.