
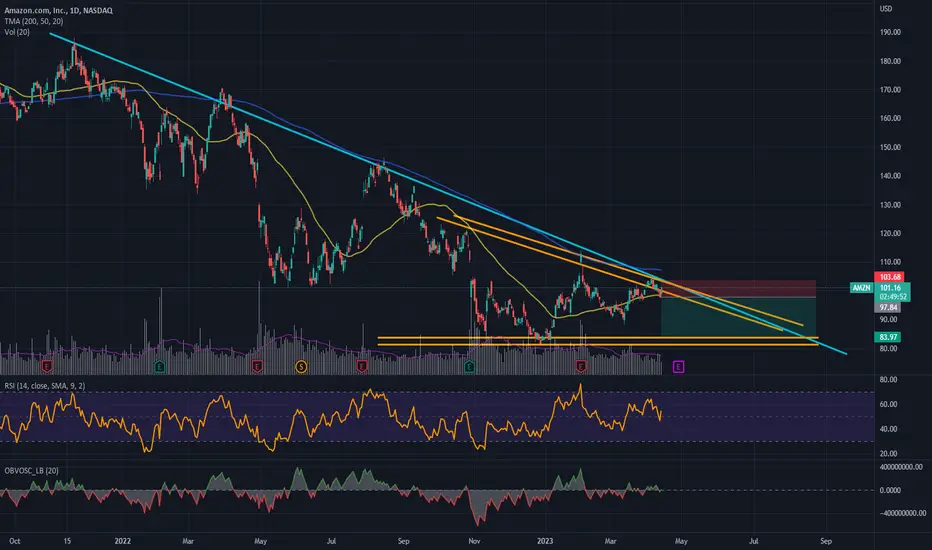
- Price below the 200 MA, confirming the general downtrend.
- Possible formation of descending triangle.
- Demand for the asset is weakening (see volume, RSI and OBV indicators).
When the price cuts below the 50 MA, the RSI is well below 50% and the OBV is red and well below the mid level, enter short. I prefer to enter my positions with confirmations of indicators, rather formations of patterns.
WARNING: THIS IS NOT A INVESTMENT ADVICE. I'M JUST POSTING MY IDEAS AND IT IS FOR EXCHANGE OPINIONS.

Thông báo miễn trừ trách nhiệm
Thông tin và các ấn phẩm này không nhằm mục đích, và không cấu thành, lời khuyên hoặc khuyến nghị về tài chính, đầu tư, giao dịch hay các loại khác do TradingView cung cấp hoặc xác nhận. Đọc thêm tại Điều khoản Sử dụng.
Thông báo miễn trừ trách nhiệm
Thông tin và các ấn phẩm này không nhằm mục đích, và không cấu thành, lời khuyên hoặc khuyến nghị về tài chính, đầu tư, giao dịch hay các loại khác do TradingView cung cấp hoặc xác nhận. Đọc thêm tại Điều khoản Sử dụng.