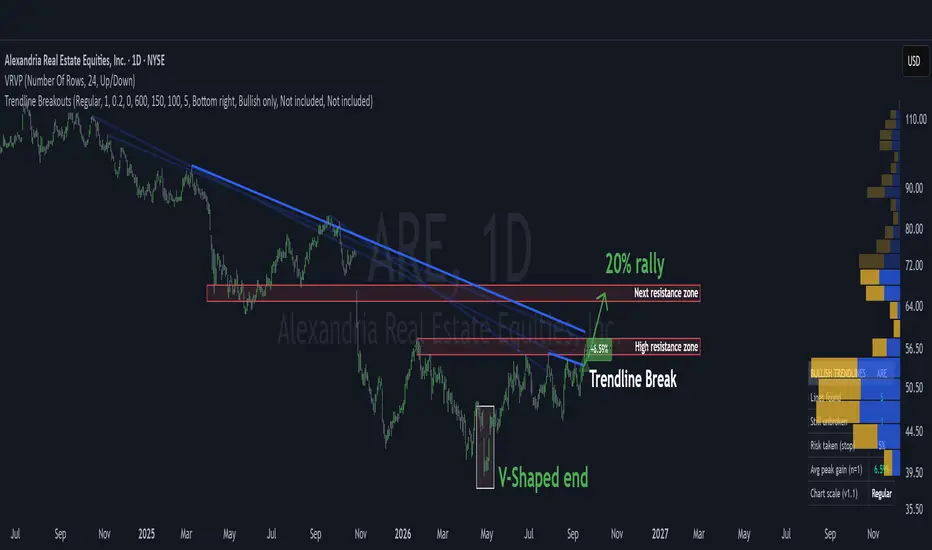
A New Trendline Break in ARE
Since spring, every rally in ARE stopped in the blue trendline. Now, price closed above it.
I care about days like this for one reason. A break day is not a normal day. In my tests, buying a stock on the day it breaks a falling trendline like this one gives about 3 times the return of buying the S&P 500 on any random day. Same 20 days, same rules.

That is why I built the indicator you see on this chart. It finds these lines by itself and marks the break. No drawing, no opinion.
The business
Alexandria owns and rents lab buildings to biotech and pharma companies. More money in life science research means more labs rented from Alexandria.
The analysts
Analysts do not see ARE as a long term buy right now. The stock trades close to what they call its fair value. So this is not a Buy and forget idea. It's a short term trade on strength, nothing more.
The chart
The fall from above $110 ended with a V shaped bottom near $40 in May. Since then, price has made higher lows and today it broke the last falling line. Right above sits the strongest resistance on the chart: the previous high, marked in red.
That is the level I watch next. Above it there is very little volume on the profile. When there are few sellers, price tends to move fast. The next resistance zone sits about 20% higher.
Since spring, every rally in
ARE stopped in the blue trendline. Now, price closed above it.I care about days like this for one reason. A break day is not a normal day. In my tests, buying a stock on the day it breaks a falling trendline like this one gives about 3 times the return of buying the S&P 500 on any random day. Same 20 days, same rules.
That is why I built the indicator you see on this chart. It finds these lines by itself and marks the break. No drawing, no opinion.
The business
Alexandria owns and rents lab buildings to biotech and pharma companies. More money in life science research means more labs rented from Alexandria.
The analysts
Analysts do not see ARE as a long term buy right now. The stock trades close to what they call its fair value. So this is not a Buy and forget idea. It's a short term trade on strength, nothing more.
The chart
The fall from above $110 ended with a V shaped bottom near $40 in May. Since then, price has made higher lows and today it broke the last falling line. Right above sits the strongest resistance on the chart: the previous high, marked in red.
That is the level I watch next. Above it there is very little volume on the profile. When there are few sellers, price tends to move fast. The next resistance zone sits about 20% higher.

Most days the market gives you nothing worth playing.
A few times a month it hands you two aces ♠️♦️.
I tell you when that happens & why, after studying more than 8 million patterns across 30 years.
👉topchartpatterns.substack.com/embed
A few times a month it hands you two aces ♠️♦️.
I tell you when that happens & why, after studying more than 8 million patterns across 30 years.
👉topchartpatterns.substack.com/embed
Bài đăng liên quan
Thông báo miễn trừ trách nhiệm
Thông tin và các ấn phẩm này không nhằm mục đích, và không cấu thành, lời khuyên hoặc khuyến nghị về tài chính, đầu tư, giao dịch hay các loại khác do TradingView cung cấp hoặc xác nhận. Đọc thêm tại Điều khoản Sử dụng.
Most days the market gives you nothing worth playing.
A few times a month it hands you two aces ♠️♦️.
I tell you when that happens & why, after studying more than 8 million patterns across 30 years.
👉topchartpatterns.substack.com/embed
A few times a month it hands you two aces ♠️♦️.
I tell you when that happens & why, after studying more than 8 million patterns across 30 years.
👉topchartpatterns.substack.com/embed
Bài đăng liên quan
Thông báo miễn trừ trách nhiệm
Thông tin và các ấn phẩm này không nhằm mục đích, và không cấu thành, lời khuyên hoặc khuyến nghị về tài chính, đầu tư, giao dịch hay các loại khác do TradingView cung cấp hoặc xác nhận. Đọc thêm tại Điều khoản Sử dụng.