
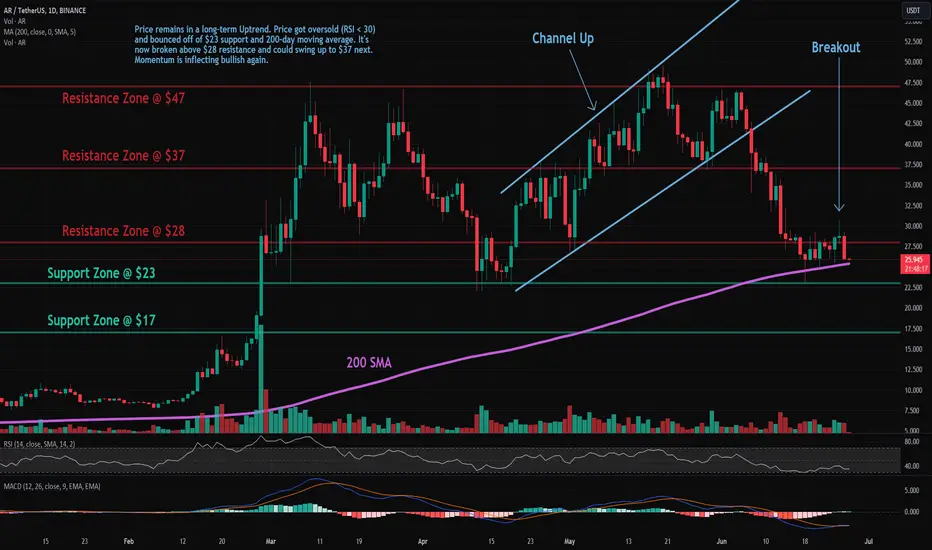
Trade setup: Price remains in a long-term Uptrend. Price got oversold (RSI < 30) and bounced off of $23 support and 200-day moving average. It's now broken above $28 resistance and could swing up to $37 next. Momentum is inflecting bullish again (MACD Histogram rising).
Pattern: Resistance Breakout. Once a price breaks above a resistance zone, it signals that buyers have absorbed all the supply from sellers at this level and price can resume it's advance. Following a resistance breakout, the next closest resistance zone becomes a price target. Learn to trade key level breakouts in Lesson 7.
Trend: Short-term trend is Down, Medium-term trend is Down and Long-term trend is Up.
Momentum is Bullish but inflecting. MACD Line is still above MACD Signal Line but momentum may have peaked since MACD Histogram bars are declining, which suggests that momentum could be nearing a downswing. Price is neither overbought nor oversold currently, based on RSI-14 levels (RSI > 30 and RSI < 70).
Support and Resistance: Nearest Support Zone is $23.00, then $17.00. Nearest Resistance Zone is $28.00, then $37.00.
Pattern: Resistance Breakout. Once a price breaks above a resistance zone, it signals that buyers have absorbed all the supply from sellers at this level and price can resume it's advance. Following a resistance breakout, the next closest resistance zone becomes a price target. Learn to trade key level breakouts in Lesson 7.
Trend: Short-term trend is Down, Medium-term trend is Down and Long-term trend is Up.
Momentum is Bullish but inflecting. MACD Line is still above MACD Signal Line but momentum may have peaked since MACD Histogram bars are declining, which suggests that momentum could be nearing a downswing. Price is neither overbought nor oversold currently, based on RSI-14 levels (RSI > 30 and RSI < 70).
Support and Resistance: Nearest Support Zone is $23.00, then $17.00. Nearest Resistance Zone is $28.00, then $37.00.

Thông báo miễn trừ trách nhiệm
Thông tin và các ấn phẩm này không nhằm mục đích, và không cấu thành, lời khuyên hoặc khuyến nghị về tài chính, đầu tư, giao dịch hay các loại khác do TradingView cung cấp hoặc xác nhận. Đọc thêm tại Điều khoản Sử dụng.
Thông báo miễn trừ trách nhiệm
Thông tin và các ấn phẩm này không nhằm mục đích, và không cấu thành, lời khuyên hoặc khuyến nghị về tài chính, đầu tư, giao dịch hay các loại khác do TradingView cung cấp hoặc xác nhận. Đọc thêm tại Điều khoản Sử dụng.