
A friend asked me yesterday: "How much higher can ASC go?"
ASC is one of those charts that Elliott Wave practitioners love: clean structure, clear wave relationships, and relatively easy labeling.
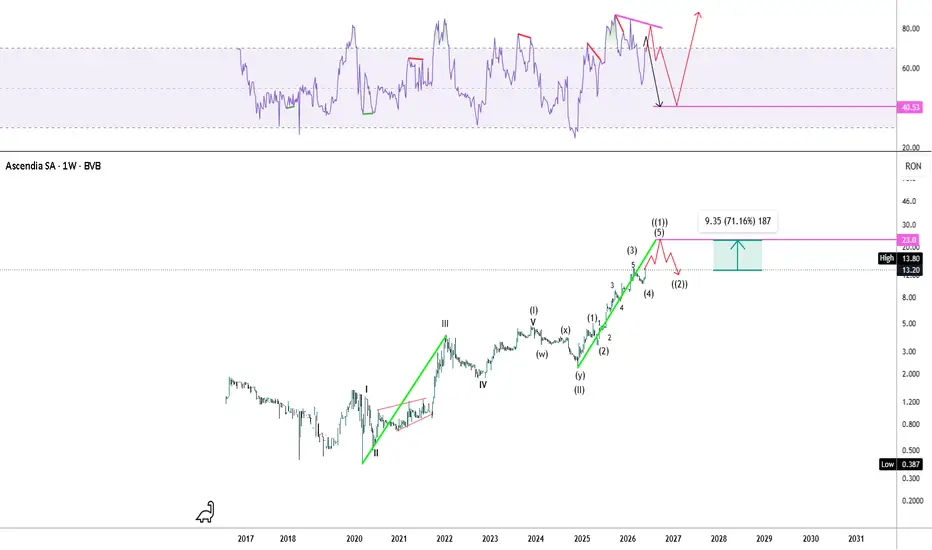
My current interpretation is that price is still developing wave (5) of ((1)) within Primary Wave III.
Using one of Elliott's common guidelines, where Wave 5 can sometimes equal Wave 1 in length, a potential target emerges around 23 RON. Of course, 5 = 1 is not a rule, only a guideline.
To strengthen this projection, I looked for additional confluences. Applying the principle of similarity, the two neon-green segments show comparable price expansions. This gives us a second confluence near the same target area.
A third possible confluence comes from time symmetry, where the duration of Wave III could be similar to the duration of wave ((1)). I consider this a weaker signal, but if price reaches 23 RON around October 2026, I'll gladly revisit this forecast.
The chart history is still limited, so I have not yet identified stronger clusters.
Important: 23 RON should not be viewed as a fixed destination. It is an optimistic projection based on the current wave structure and must always be evaluated in the context of market conditions and company fundamentals.
RSI adds another piece to the puzzle. The indicator is already overbought and showing bearish divergence, a common characteristic near the end of a cycle. I will consider wave (5) of ((1)) complete when RSI fails to reclaim the 70 level. Until then, I expect wave (5) to continue building and potentially generate one or two additional divergences.
As for moving averages (MA30, MA50, MA100 and MA200), if wave (5) extends and completes ((1)), price will continue moving away from its averages. Eventually, those averages tend to act as a magnet, increasing the probability of a corrective phase once the impulse is exhausted.
This remains a working Elliott Wave scenario, not a prediction.

Thông báo miễn trừ trách nhiệm
Thông tin và các ấn phẩm này không nhằm mục đích, và không cấu thành, lời khuyên hoặc khuyến nghị về tài chính, đầu tư, giao dịch hay các loại khác do TradingView cung cấp hoặc xác nhận. Đọc thêm tại Điều khoản Sử dụng.
Thông báo miễn trừ trách nhiệm
Thông tin và các ấn phẩm này không nhằm mục đích, và không cấu thành, lời khuyên hoặc khuyến nghị về tài chính, đầu tư, giao dịch hay các loại khác do TradingView cung cấp hoặc xác nhận. Đọc thêm tại Điều khoản Sử dụng.