 ASIANPAINT
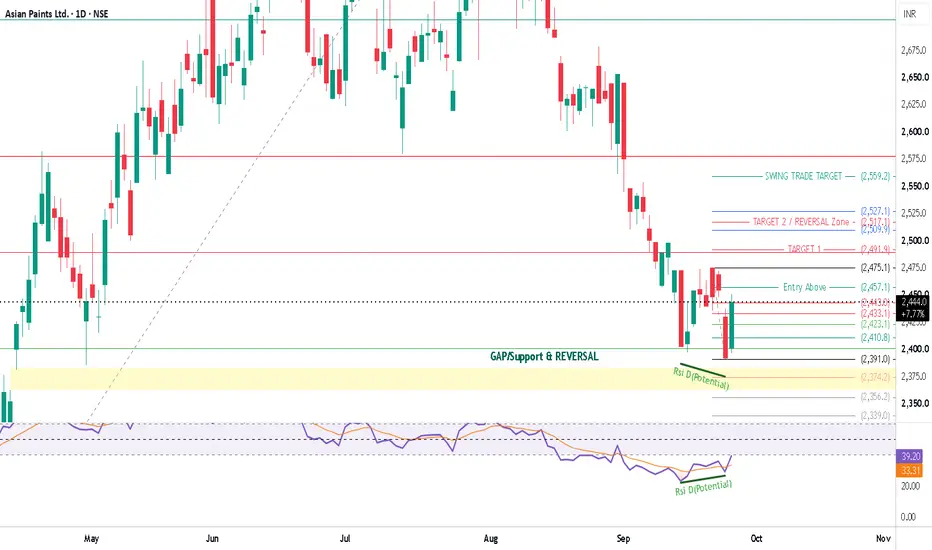
Asian Paints Ltd. is attempting a technical reversal on the daily chart after experiencing a steep correction from its high. Price recently swept into a lower demand area, creating a base low at ₹2,356.20 inside the major GAP/Support & REVERSAL box (₹2,356.20 – ₹2,391.00). This lower test is accompanied by a clear RSI Bullish Divergence (Rsi D Potential), as the RSI oscillator makes higher lows against lower price levels. Currently trading at ₹2,444.00 (+2.14%), price is approaching the immediate Entry Above trigger level at ₹2,457.10 and secondary breakout point at ₹2,475.10.
🔹 PATTERN: RSI BULLISH DIVERGENCE & GAP SUPPORT REVERSAL
• RSI Bullish Divergence (Rsi D Potential): Price formed lower base lows while the 14-period RSI printed higher bottoms (rising from ~20.00 to 39.20).
• GAP/Support & REVERSAL Zone: A highlighted yellow horizontal demand zone spanning between ₹2,356.20 and ₹2,391.00.
• Consolidation Range: Short-term base building between support at ₹2,410.80 – ₹2,423.10 and overhead resistance at ₹2,457.10 – ₹2,475.10.
• Immediate Triggers: Initial Entry Above trigger at ₹2,457.10 and key horizontal breakout entry at ₹2,475.10.
🟢 UPSIDE SCENARIO – BULLISH BREAKOUT
• Early Entry Level (BUY Entry): ₹2,457.10 (Entry Above)
• Primary Breakout Level: ₹2,475.10 (+0.73% move from ₹2,457.10 BUY entry)
• Confirmation Required: Daily candle close above ₹2,457.10 – ₹2,475.10
• TARGET 1: ₹2,491.90 (+1.42% move from ₹2,457.10 BUY entry)
• TARGET 2 / REVERSAL Zone: ₹2,509.90 / ₹2,517.10 / ₹2,527.10 (+2.15% to +2.85% move from BUY entry)
• SWING TRADE TARGET: ₹2,559.20 (+4.16% move from ₹2,457.10 BUY entry)
🔴 DOWNSIDE SCENARIO – BEARISH BREAKDOWN
• Weakening Level: Loss of immediate base support at ₹2,423.10 – ₹2,410.80
• Breakdown Level: Below ₹2,391.00 into the support zone
• Important Support Levels: ₹2,433.10, ₹2,423.10, ₹2,410.80, ₹2,391.00 (GAP/Support), ₹2,374.20, ₹2,356.20, and ₹2,339.00
• Invalidation / Stop Loss (SL): Daily close below ₹2,356.20 (-4.11% SL from ₹2,457.10 BUY entry).
🔹 MY BREAKOUT & EXIT RULE
If price crosses above a key resistance level (such as ₹2,457.10, ₹2,475.10, or ₹2,491.90) and makes a High above that level, but closes below that same level, I consider it a failed breakout/rejection and the BUYER NEEDS TO EXIT THE TRADE.
High above level + Close below level = Failed breakout → EXIT BUY TRADE.
🎯 MY TRADE ROADMAP
Bullish Breakout Path:
₹2,457.10 Early Entry Above (BUY Entry)
↓
₹2,475.10 Primary Breakout Entry (+0.73% from BUY Entry)
↓
₹2,491.90 TARGET 1 (+1.42% from BUY Entry)
↓
₹2,509.90 / ₹2,517.10 / ₹2,527.10 TARGET 2 / REVERSAL Zone (+2.15% to +2.85% from BUY Entry)
↓
₹2,559.20 SWING TRADE TARGET (+4.16% from BUY Entry)
Bearish Breakdown Path:
Rejection near ₹2,457.10 / ₹2,475.10
↓
₹2,433.10 / ₹2,423.10 Support
↓
₹2,410.80 Intermediate Support
↓
₹2,391.00 – ₹2,356.20 GAP/Support & REVERSAL Zone (Stop Loss -4.11% from BUY Entry)
🔑 MY VIEW
The preferred setup favors a bullish reversal, provided price maintains support above ₹2,410.80 and delivers a confirmed daily close above the ₹2,457.10 BUY entry level. The presence of potential RSI bullish divergence near key gap support points to momentum accumulation.
The bullish thesis strengthens once price trades and closes above ₹2,457.10 (BUY Entry) and ₹2,475.10, opening the path toward ₹2,491.90 (+1.42% from BUY Entry), the ₹2,509.90 – ₹2,527.10 reversal zone (+2.15% to +2.85% from BUY Entry), and ultimately the SWING TRADE TARGET at ₹2,559.20 (+4.16% from BUY Entry). The setup weakens if price gets rejected at resistance and breaks down through the demand base, with invalidation/SL placed at a daily close below ₹2,356.20 (-4.11% from BUY Entry). A breakout is confirmed only with a proper daily candle close above trigger levels, strictly adhering to the candle-close exit rule if a rejection occurs.
---
This is technical analysis based on chart structure, price levels, and visual patterns shown above. It is not financial advice. Market conditions can change and actual price movement may differ from projected levels.

Thông báo miễn trừ trách nhiệm
Thông tin và các ấn phẩm này không nhằm mục đích, và không cấu thành, lời khuyên hoặc khuyến nghị về tài chính, đầu tư, giao dịch hay các loại khác do TradingView cung cấp hoặc xác nhận. Đọc thêm tại Điều khoản Sử dụng.
Thông báo miễn trừ trách nhiệm
Thông tin và các ấn phẩm này không nhằm mục đích, và không cấu thành, lời khuyên hoặc khuyến nghị về tài chính, đầu tư, giao dịch hay các loại khác do TradingView cung cấp hoặc xác nhận. Đọc thêm tại Điều khoản Sử dụng.