
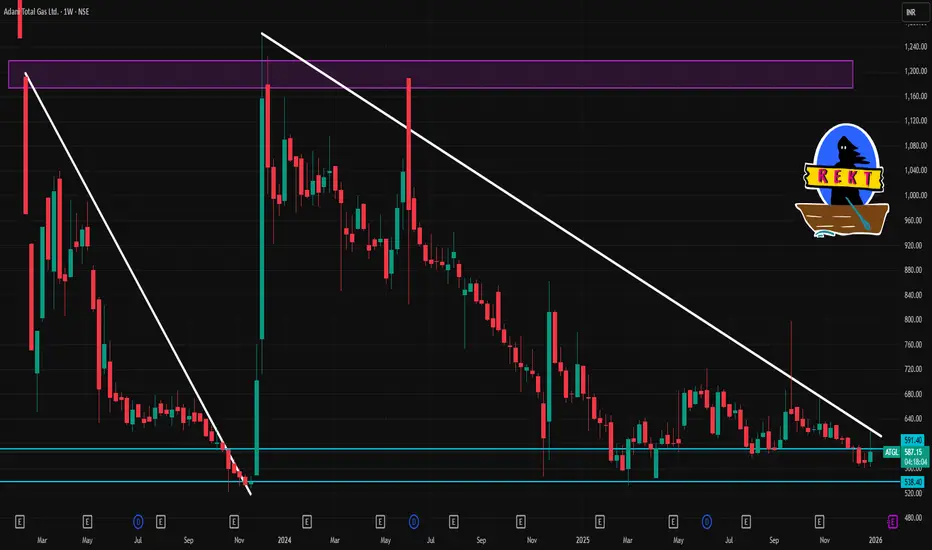
📊 Latest Price (approx): ~₹590–₹595 on NSE (price fluctuates within the day) — current levels seen near this range.
📈 Weekly Support & Resistance Levels (pivot‑based)
These are weekly pivot‑derived levels that traders often use to gauge likely support and resistance zones for the week ahead:
🔹 Weekly Resistance Levels
R1: ~₹622
R2: ~₹637
R3: ~₹657
🔸 Weekly Pivot (mid zone): ~₹602
🛡️ Weekly Support Levels
S1: ~₹587
S2: ~₹567
S3: ~₹552
These weekly pivots are from standard pivot point calculations and give you the broad weekly range to watch.
📍 Key Round Levels to Watch (Weekly)
Resistance zones:
~₹620–₹630: short‑term overhead supply/resistance.
~₹650+: higher resistance if the market turns bullish later in the week.
Support zones:
~₹580: immediate support around current price band (often reacts intraday).
~₹560–₹570: stronger weekly support — key level if price weakens.
~₹550: deeper support on weekly frame.
📌 Weekly Strategy Levels
👉 Bullish scenario: A sustained close above ₹620 for the week could open up moves toward ₹637–₹657.
👉 Bearish scenario: If the stock breaks below ₹587 on a weekly close, watch support ₹567, then ₹552.
📈 Weekly Support & Resistance Levels (pivot‑based)
These are weekly pivot‑derived levels that traders often use to gauge likely support and resistance zones for the week ahead:
🔹 Weekly Resistance Levels
R1: ~₹622
R2: ~₹637
R3: ~₹657
🔸 Weekly Pivot (mid zone): ~₹602
🛡️ Weekly Support Levels
S1: ~₹587
S2: ~₹567
S3: ~₹552
These weekly pivots are from standard pivot point calculations and give you the broad weekly range to watch.
📍 Key Round Levels to Watch (Weekly)
Resistance zones:
~₹620–₹630: short‑term overhead supply/resistance.
~₹650+: higher resistance if the market turns bullish later in the week.
Support zones:
~₹580: immediate support around current price band (often reacts intraday).
~₹560–₹570: stronger weekly support — key level if price weakens.
~₹550: deeper support on weekly frame.
📌 Weekly Strategy Levels
👉 Bullish scenario: A sustained close above ₹620 for the week could open up moves toward ₹637–₹657.
👉 Bearish scenario: If the stock breaks below ₹587 on a weekly close, watch support ₹567, then ₹552.

Contact Knowledgehub for a detailed consultation: Dm on WhatsApp: [wa.link/a2o0kz]-
Phone No: [+91 93102 26243]-
Email: [tradingviewknowledgehub@gmail.com]---
-- Let’s achieve success together!
Phone No: [+91 93102 26243]-
Email: [tradingviewknowledgehub@gmail.com]---
-- Let’s achieve success together!
Bài đăng liên quan
Thông báo miễn trừ trách nhiệm
Thông tin và các ấn phẩm này không nhằm mục đích, và không cấu thành, lời khuyên hoặc khuyến nghị về tài chính, đầu tư, giao dịch hay các loại khác do TradingView cung cấp hoặc xác nhận. Đọc thêm tại Điều khoản Sử dụng.
Contact Knowledgehub for a detailed consultation: Dm on WhatsApp: [wa.link/a2o0kz]-
Phone No: [+91 93102 26243]-
Email: [tradingviewknowledgehub@gmail.com]---
-- Let’s achieve success together!
Phone No: [+91 93102 26243]-
Email: [tradingviewknowledgehub@gmail.com]---
-- Let’s achieve success together!
Bài đăng liên quan
Thông báo miễn trừ trách nhiệm
Thông tin và các ấn phẩm này không nhằm mục đích, và không cấu thành, lời khuyên hoặc khuyến nghị về tài chính, đầu tư, giao dịch hay các loại khác do TradingView cung cấp hoặc xác nhận. Đọc thêm tại Điều khoản Sử dụng.