
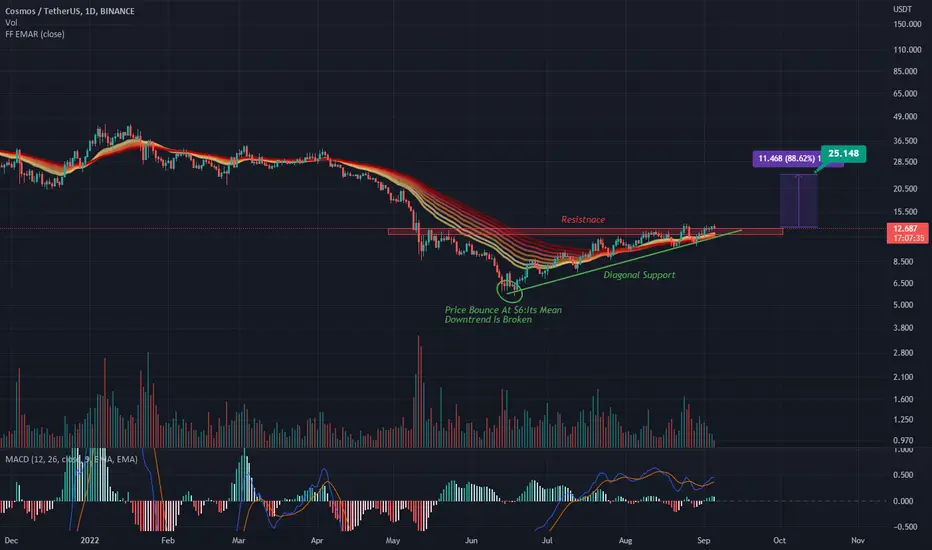
Hello everyone, today i'm going analysis ATOM/USDT on Daily time frame.
1)First we can clearly see ATOM strong Bounce from $6 to $12, its mean Downtrend is broken and now we are Uptrend cycle.
2)In chart we formed Ascending Triangle pattern,we have diagonal Support line and horizontal Resistance level at $12 approximately.
3)Now price squeezing in Ascending Triangle and price can breakout from $12 at any moment,so for clear breakout price must close behind Ascending Triangle approximately at $15 with good Volume.
4)We also will using Ribbon trend indicator,we can clearly see price above Ribbon line its mean we are now in momentum.
5)MACD oscillator is above Histogram 0 line its Bullish and also we have Bullish cross.
i'm will happy if this analysis will help you

Thông báo miễn trừ trách nhiệm
Thông tin và các ấn phẩm này không nhằm mục đích, và không cấu thành, lời khuyên hoặc khuyến nghị về tài chính, đầu tư, giao dịch hay các loại khác do TradingView cung cấp hoặc xác nhận. Đọc thêm tại Điều khoản Sử dụng.
Thông báo miễn trừ trách nhiệm
Thông tin và các ấn phẩm này không nhằm mục đích, và không cấu thành, lời khuyên hoặc khuyến nghị về tài chính, đầu tư, giao dịch hay các loại khác do TradingView cung cấp hoặc xác nhận. Đọc thêm tại Điều khoản Sử dụng.