

Hey guys,
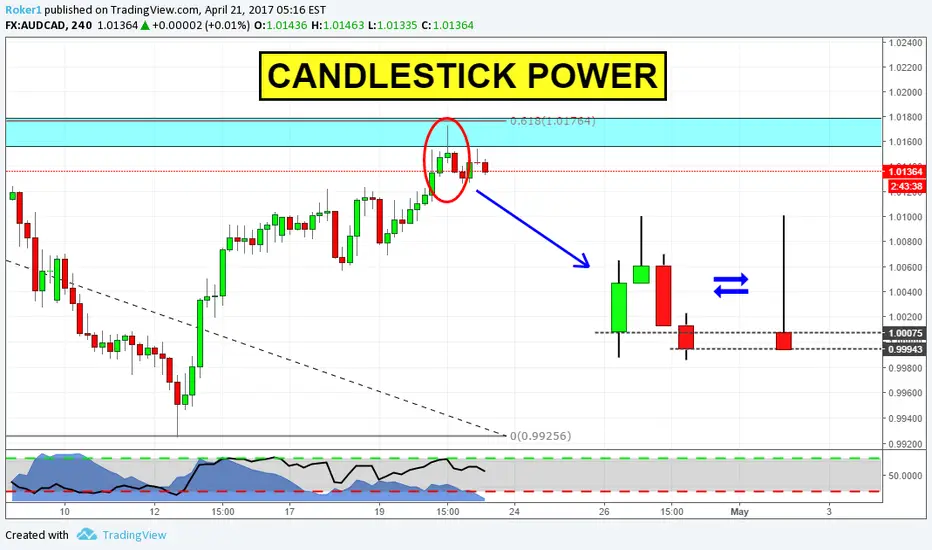
today i want to show you the power of candlestick combined with structure. Here is the 4H chart on AUDCAD, and the price is coming back to retest the 618 level of the bigger daily impulse; this level also lines up with a structure (that you can see if you scroll the chart).
With this two level i was able to draw a box where i can search for shorting opportunities down on lower timeframes, and that is what happened.
As soon as price reached this zone it stopped its upward move and gave us a strong selling pressure signal (pinbar) followed by an engulfing candle.
In order to get the real power of candlestick you can sometimes combine 3-4 candles together and see what's come out. In this case on the right i've drawn the result and it shows us very strong sellers. At this point, knowing the level it's so much important i want to short at the first retracment.
Stops above highs, first target at 1,5:1 RR and second target to be determined.
If you have questions or you want to share your view, feel free to comment below.
Otherwise, see you in the next chart!
Đóng lệnh: dừng lỗ
Trading is a probability game and this time my analysis proved wrong!
Thông báo miễn trừ trách nhiệm
Thông tin và các ấn phẩm này không nhằm mục đích, và không cấu thành, lời khuyên hoặc khuyến nghị về tài chính, đầu tư, giao dịch hay các loại khác do TradingView cung cấp hoặc xác nhận. Đọc thêm tại Điều khoản Sử dụng.
Thông báo miễn trừ trách nhiệm
Thông tin và các ấn phẩm này không nhằm mục đích, và không cấu thành, lời khuyên hoặc khuyến nghị về tài chính, đầu tư, giao dịch hay các loại khác do TradingView cung cấp hoặc xác nhận. Đọc thêm tại Điều khoản Sử dụng.