

Monthly Time Frame

Weekly Time Frame

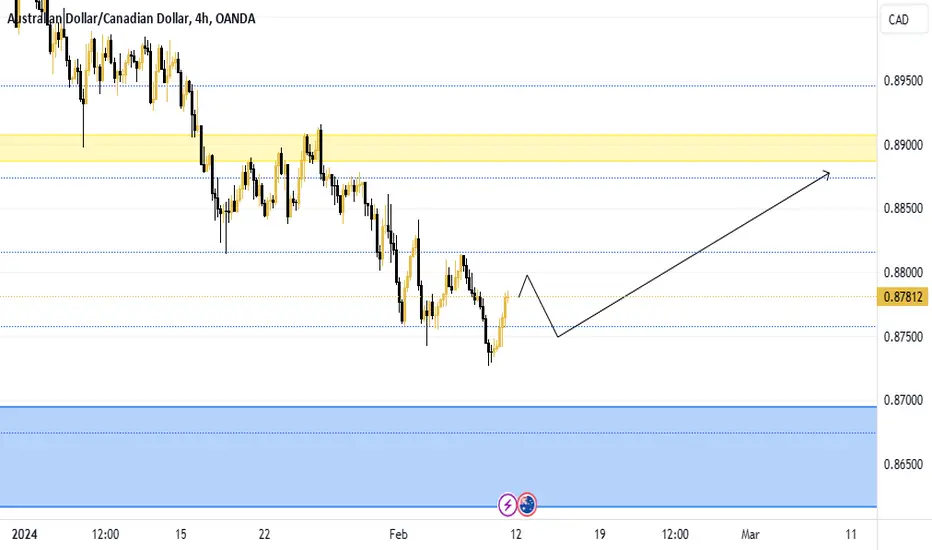
4Hour Time Frame

- Price made a bearish push until it closed as a doji candlestick found support at the weekly demand zone then made a bullish push
- After the bullish push price met resistance at a weekly supply zone ultimately forming a high. Price then began to sell off (retrace).
Weekly Time Frame
- Price met resistance, formed a double top, and closed as a doji followed by a bearish engulfing signaling a selloff.
- During the sell-off (retracement) price found support at the 61.8 fib level and closed as doji candle stick signaling a potential reversal.
4Hour Time Frame
- I am anticipating price forming a double bottom as a candlestick reversal pattern.
- I am expecting a bullish push to 0.895
Ghi chú
Price is beginning to make its bullish push as anticapted.
Thông báo miễn trừ trách nhiệm
Thông tin và các ấn phẩm này không nhằm mục đích, và không cấu thành, lời khuyên hoặc khuyến nghị về tài chính, đầu tư, giao dịch hay các loại khác do TradingView cung cấp hoặc xác nhận. Đọc thêm tại Điều khoản Sử dụng.
Thông báo miễn trừ trách nhiệm
Thông tin và các ấn phẩm này không nhằm mục đích, và không cấu thành, lời khuyên hoặc khuyến nghị về tài chính, đầu tư, giao dịch hay các loại khác do TradingView cung cấp hoặc xác nhận. Đọc thêm tại Điều khoản Sử dụng.