

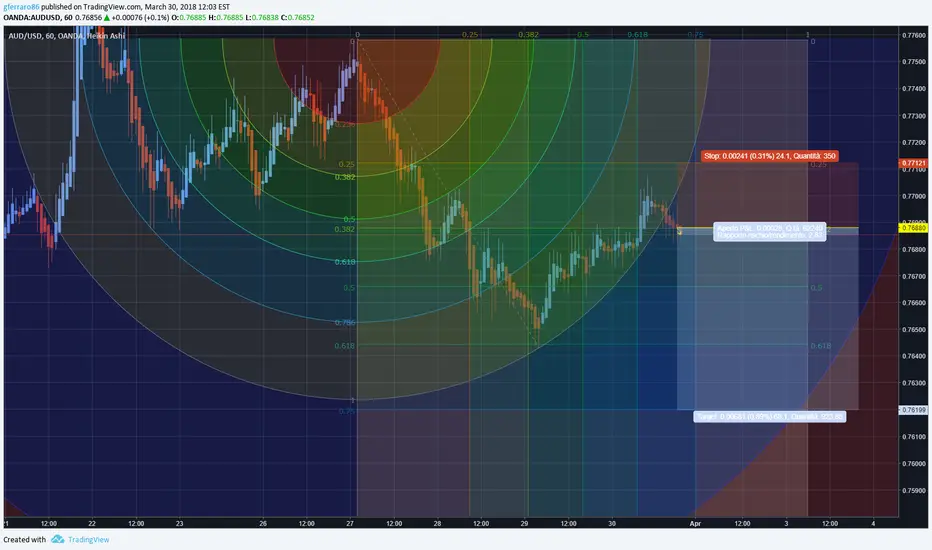
AUDUSD short
Ghi chú
The idea is really easy and completely based on math. The audusd graph is actually a downtrend. I used the Fibonacci half circle to identify interesting price levels where the price has moved in the near past and where it's still reacting now. As soon as the price, after jumping up and down inside the tunnel, broken down again I opened a sell position. I also used the gann square to identify my target points and my stop loss. Really basic reference points. You can Easley find all the interesting points onthe graph I've shared
Thông báo miễn trừ trách nhiệm
Thông tin và các ấn phẩm này không nhằm mục đích, và không cấu thành, lời khuyên hoặc khuyến nghị về tài chính, đầu tư, giao dịch hay các loại khác do TradingView cung cấp hoặc xác nhận. Đọc thêm tại Điều khoản Sử dụng.
Thông báo miễn trừ trách nhiệm
Thông tin và các ấn phẩm này không nhằm mục đích, và không cấu thành, lời khuyên hoặc khuyến nghị về tài chính, đầu tư, giao dịch hay các loại khác do TradingView cung cấp hoặc xác nhận. Đọc thêm tại Điều khoản Sử dụng.