
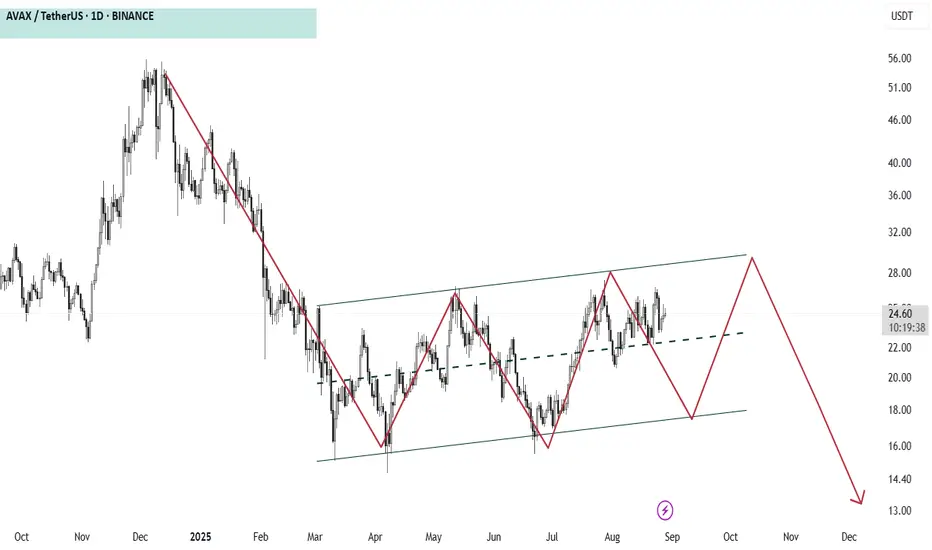
The chart of AVAX/USDT shows a rising channel that has been forming since March 2025. Price is moving up and down inside this channel, making lower highs and higher lows in a zig-zag pattern.
The projection suggests that after testing the upper side of the channel near $28, the price may fall back to the lower boundary around $18, and eventually break down towards $13–14.
This pattern indicates that while the market is still respecting the channel for now, the overall expectation is a bearish breakout in the medium term.
What do you think ?
The projection suggests that after testing the upper side of the channel near $28, the price may fall back to the lower boundary around $18, and eventually break down towards $13–14.
This pattern indicates that while the market is still respecting the channel for now, the overall expectation is a bearish breakout in the medium term.
What do you think ?

Thông báo miễn trừ trách nhiệm
Thông tin và các ấn phẩm này không nhằm mục đích, và không cấu thành, lời khuyên hoặc khuyến nghị về tài chính, đầu tư, giao dịch hay các loại khác do TradingView cung cấp hoặc xác nhận. Đọc thêm tại Điều khoản Sử dụng.
Thông báo miễn trừ trách nhiệm
Thông tin và các ấn phẩm này không nhằm mục đích, và không cấu thành, lời khuyên hoặc khuyến nghị về tài chính, đầu tư, giao dịch hay các loại khác do TradingView cung cấp hoặc xác nhận. Đọc thêm tại Điều khoản Sử dụng.