
Hello?
Traders, welcome.
If you "Follow", you can always get new information quickly.
Please also click "Boost".
Have a good day.
-------------------------------------
(AVAXBTC 1W Chart)

In order to get the power to rise, it must be supported in the range of 0.0007 164 to 0.0009 769.
---------------------------------------
(AVAXUSDT 1W Chart)

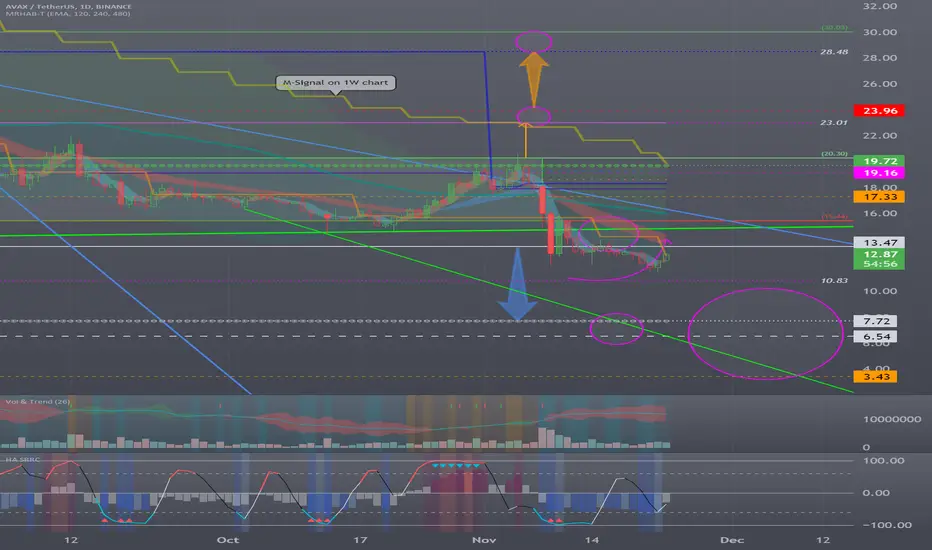
The 15.44-20.30 interval is the one that determines the trend.
Therefore, it is important to be supported by rising to the 15.44-20.30 section.
However, the 13.47 point is the volume profile section, and if resistance is received at 13.47, there is a possibility of falling to around 6.54, so you need to think about countermeasures.
(1D chart)
It will be important if the price can quickly rise above 13.47 and sustain the price.
If this is not the case, it may lead to further declines, so cautious trading is required.
-------------------------------------------------- -------------------------------------------
** All descriptions are for reference only and do not guarantee profit or loss in investment.
** If you share this chart, you can use the indicators normally.
** The MRHAB-T indicator includes indicators that indicate points of support and resistance.
** SR_R_C indicators are displayed as StochRSI (line), RSI (columns), and CCI (bgcolor).
** The CCI indicator is displayed in the overbought section (CCI > +100) and oversold section (CCI < -100).
(Short-term Stop Loss can be said to be a point where profit or loss can be preserved or additional entry can be made by split trading. This is a short-term investment perspective.)
---------------------------------
Traders, welcome.
If you "Follow", you can always get new information quickly.
Please also click "Boost".
Have a good day.
-------------------------------------
(AVAXBTC 1W Chart)
In order to get the power to rise, it must be supported in the range of 0.0007 164 to 0.0009 769.
---------------------------------------
(AVAXUSDT 1W Chart)
The 15.44-20.30 interval is the one that determines the trend.
Therefore, it is important to be supported by rising to the 15.44-20.30 section.
However, the 13.47 point is the volume profile section, and if resistance is received at 13.47, there is a possibility of falling to around 6.54, so you need to think about countermeasures.
(1D chart)
It will be important if the price can quickly rise above 13.47 and sustain the price.
If this is not the case, it may lead to further declines, so cautious trading is required.
-------------------------------------------------- -------------------------------------------
** All descriptions are for reference only and do not guarantee profit or loss in investment.
** If you share this chart, you can use the indicators normally.
** The MRHAB-T indicator includes indicators that indicate points of support and resistance.
** SR_R_C indicators are displayed as StochRSI (line), RSI (columns), and CCI (bgcolor).
** The CCI indicator is displayed in the overbought section (CCI > +100) and oversold section (CCI < -100).
(Short-term Stop Loss can be said to be a point where profit or loss can be preserved or additional entry can be made by split trading. This is a short-term investment perspective.)
---------------------------------

[Practical trading strategy using HA-MS and SBOD]
youtu.be/aceN1AttX1Y
youtu.be/aceN1AttX1Y
Bài đăng liên quan
Thông báo miễn trừ trách nhiệm
Thông tin và các ấn phẩm này không nhằm mục đích, và không cấu thành, lời khuyên hoặc khuyến nghị về tài chính, đầu tư, giao dịch hay các loại khác do TradingView cung cấp hoặc xác nhận. Đọc thêm tại Điều khoản Sử dụng.