
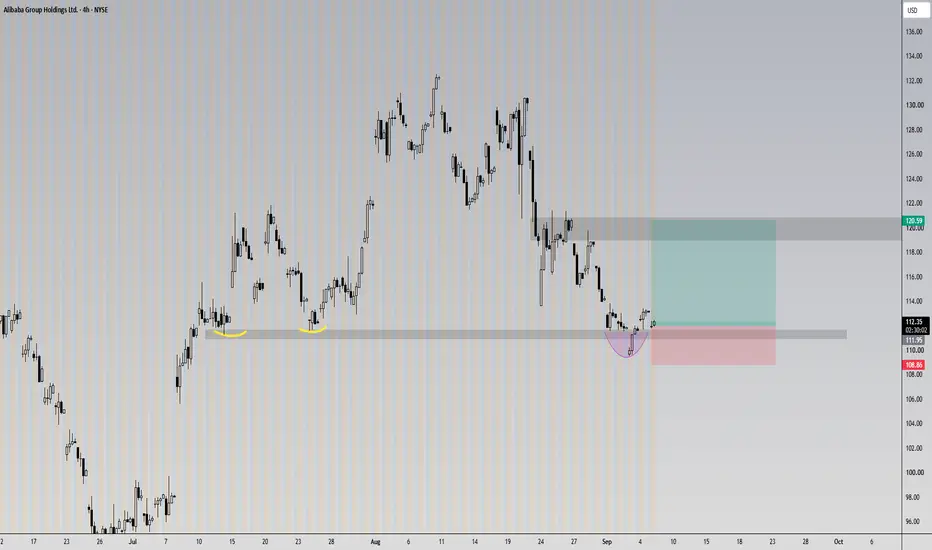
Tracking a classic liquidity sweep and deviation scenario in BABA's price action.
🎯 Setup & Expectation:
The price recently swept the sell-side liquidity resting below the relative equal lows marked with the yellow curves on the left (highlighted by the purple deviation zone).
Reclaiming the support level immediately after triggering those stops and creating a fake breakdown (bear trap) suggests that the downward momentum has exhausted and the bias is shifting to the upside. Following this liquidity grab, I expect the price to initiate a strong bullish move towards the upper main resistance zone (around the 120.50 level).
📍 Stop-loss can be placed below the recent swing low / the tip of the liquidity sweep wick (around 108.80).
🎯 Setup & Expectation:
The price recently swept the sell-side liquidity resting below the relative equal lows marked with the yellow curves on the left (highlighted by the purple deviation zone).
Reclaiming the support level immediately after triggering those stops and creating a fake breakdown (bear trap) suggests that the downward momentum has exhausted and the bias is shifting to the upside. Following this liquidity grab, I expect the price to initiate a strong bullish move towards the upper main resistance zone (around the 120.50 level).
📍 Stop-loss can be placed below the recent swing low / the tip of the liquidity sweep wick (around 108.80).

Thông báo miễn trừ trách nhiệm
Thông tin và các ấn phẩm này không nhằm mục đích, và không cấu thành, lời khuyên hoặc khuyến nghị về tài chính, đầu tư, giao dịch hay các loại khác do TradingView cung cấp hoặc xác nhận. Đọc thêm tại Điều khoản Sử dụng.
Thông báo miễn trừ trách nhiệm
Thông tin và các ấn phẩm này không nhằm mục đích, và không cấu thành, lời khuyên hoặc khuyến nghị về tài chính, đầu tư, giao dịch hay các loại khác do TradingView cung cấp hoặc xác nhận. Đọc thêm tại Điều khoản Sử dụng.