
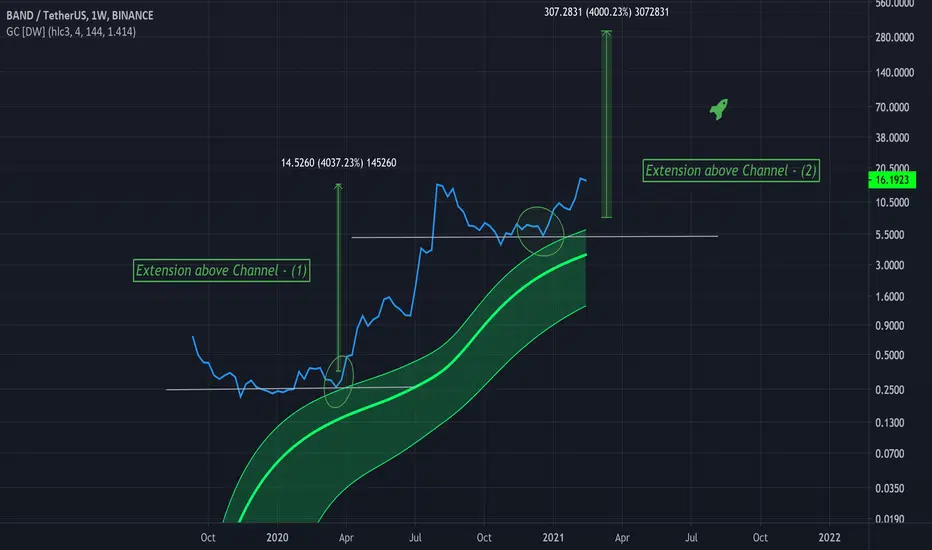
Within the green circles touches on the Gaussian channel can be seen, well, clearly on the first one, the second one is a bit above.
This is a great bounce area for price as price is in a full bull trend, as shown by the Gaussian indicator.
This is the chart for BANDUSDT, and if this second circle acts as a touch on the Gaussian indicator a strong bounce upward could occur.
And if history holds any merit, a 4000% move up could be in play.
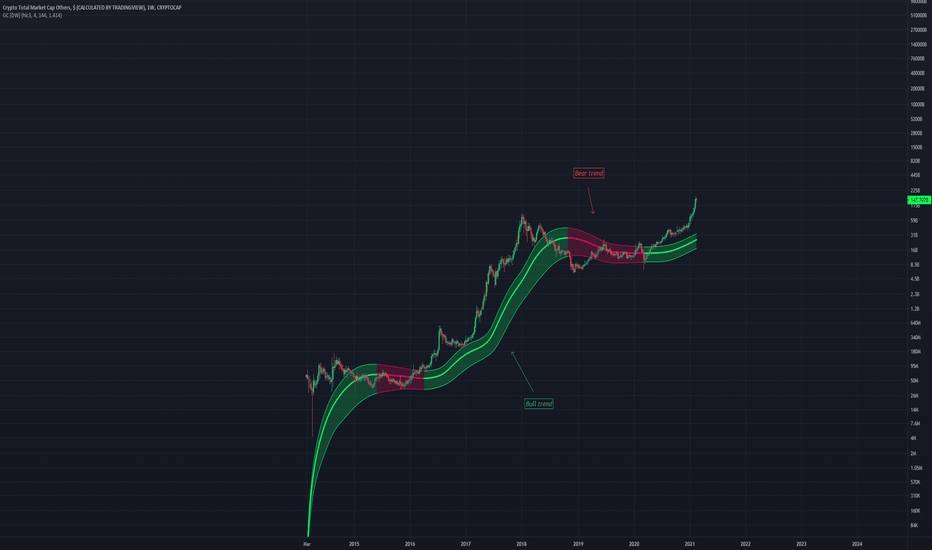
Above is a chart that has a link to this indicator in the comments.
It is very helpful.
This is a great bounce area for price as price is in a full bull trend, as shown by the Gaussian indicator.
This is the chart for BANDUSDT, and if this second circle acts as a touch on the Gaussian indicator a strong bounce upward could occur.
And if history holds any merit, a 4000% move up could be in play.
Above is a chart that has a link to this indicator in the comments.
It is very helpful.

Thông báo miễn trừ trách nhiệm
Thông tin và các ấn phẩm này không nhằm mục đích, và không cấu thành, lời khuyên hoặc khuyến nghị về tài chính, đầu tư, giao dịch hay các loại khác do TradingView cung cấp hoặc xác nhận. Đọc thêm tại Điều khoản Sử dụng.
Thông báo miễn trừ trách nhiệm
Thông tin và các ấn phẩm này không nhằm mục đích, và không cấu thành, lời khuyên hoặc khuyến nghị về tài chính, đầu tư, giao dịch hay các loại khác do TradingView cung cấp hoặc xác nhận. Đọc thêm tại Điều khoản Sử dụng.