
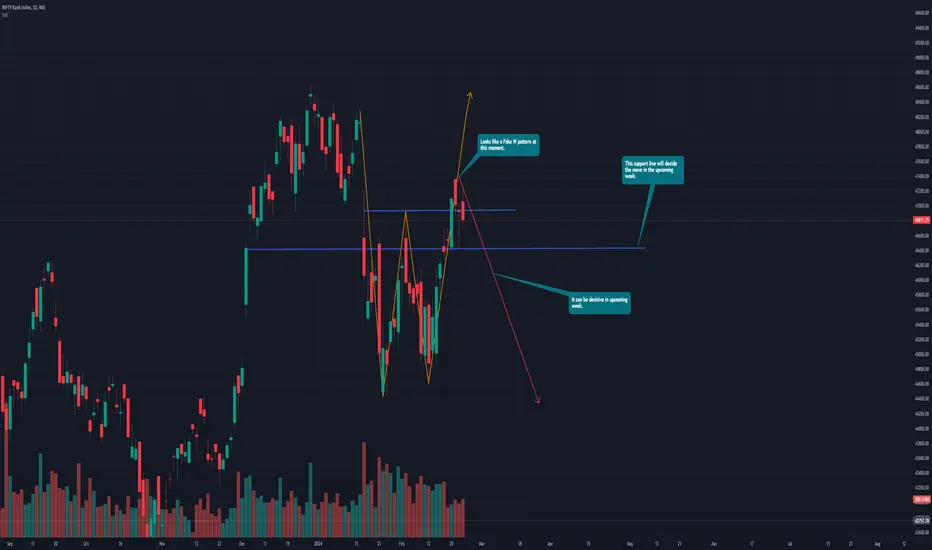
Hourly chart shows M pattern breakout. Initially i though it is head and shoulder but instead it formed M pattern and trend indicates downward movement. (posted in my previous post).
Right now, on Daily chart it looks it didn't proceed with W pattern. BankNifty has trapped CE buyers who would have thought that it'll fill the gap upper side. Some downnside movement in past 3 days but it was a good fight. Bulls are not exhausted yet.
Right now, on Daily chart it looks it didn't proceed with W pattern. BankNifty has trapped CE buyers who would have thought that it'll fill the gap upper side. Some downnside movement in past 3 days but it was a good fight. Bulls are not exhausted yet.

Thanks.
TradeTech Analysis
Telegram Channel - t.me/Tradetech2024
Youtube Channel - youtube.com/@TradeTechAnalysis
Website - tradetechanalysis.com/
Super Profile - superprofile.bio/tradetechanalysis
TradeTech Analysis
Telegram Channel - t.me/Tradetech2024
Youtube Channel - youtube.com/@TradeTechAnalysis
Website - tradetechanalysis.com/
Super Profile - superprofile.bio/tradetechanalysis
Bài đăng liên quan
Thông báo miễn trừ trách nhiệm
Thông tin và các ấn phẩm này không nhằm mục đích, và không cấu thành, lời khuyên hoặc khuyến nghị về tài chính, đầu tư, giao dịch hay các loại khác do TradingView cung cấp hoặc xác nhận. Đọc thêm tại Điều khoản Sử dụng.