
Macro Geometry:
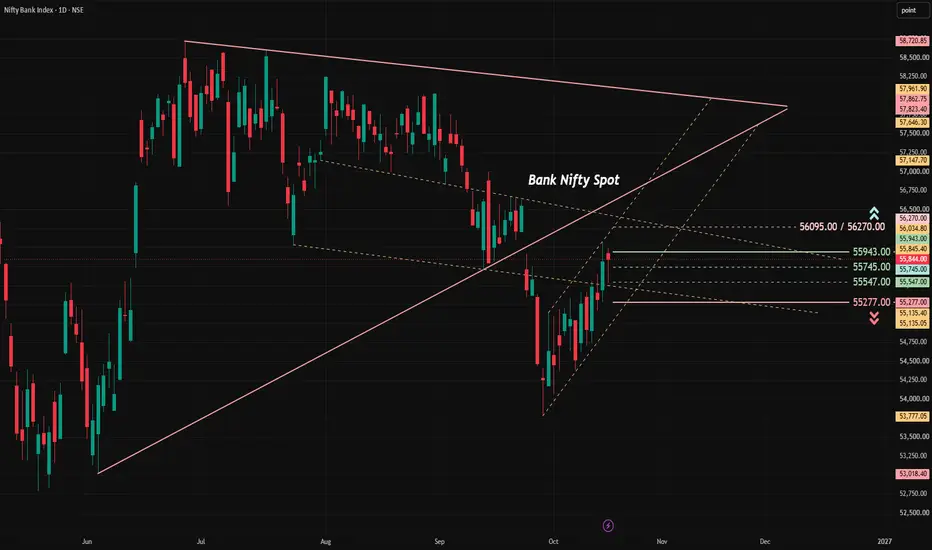
The chart features a large multi-month symmetrical triangle / contracting wedge pattern defined by the solid pink trendlines. Price broke below the primary ascending trendline support near 55,400–55,500, dropping sharply into an impulse down-leg. A secondary descending parallel channel (dashed yellow lines) captured the intermediate corrective decline, from which price has staged a V-shaped counter-trend recovery back toward the breakdown retest zone. Technical ObservationsBreakdown Retest / Pullback Zone: The recent rally from the swing low is a counter-trend retracement moving directly back toward the underside of the broken ascending trendline and the upper boundary of the falling channel. Candle Behavior at Resistance: The latest session closed as a narrow-range candle with upper and lower wicks right at 55,844.00, struggling just below the horizontal green resistance line at 55,943.00. This indicates seller absorption and hesitation as the index approaches supply.
Ascending Micro-Channel: The low-to-high move from the base has followed a steep micro-ascending channel (dashed yellow support line). Any decisive break below this rising slope signals the resumption of the broader breakdown impulse.
Actionable Scenarios
Bearish Continuation (Primary Trend):
Trigger: Failure to clear 55,943 – 56,095, followed by a daily close below 55,547.00.
Targets: 55,277.00, followed by a retest of the recent swing lows around the lower channel boundary.
Invalidation: Sustained close above 56,270.00.
Bullish Reclaim (Trend Invalidation):Trigger: Strong daily closing candle above 56,270.00, which would confirm a "bear trap / false breakdown" back inside the macro wedge.
Targets: Upper descending trendline resistance toward the top of the wedge structure.
Like Share follow......
The chart features a large multi-month symmetrical triangle / contracting wedge pattern defined by the solid pink trendlines. Price broke below the primary ascending trendline support near 55,400–55,500, dropping sharply into an impulse down-leg. A secondary descending parallel channel (dashed yellow lines) captured the intermediate corrective decline, from which price has staged a V-shaped counter-trend recovery back toward the breakdown retest zone. Technical ObservationsBreakdown Retest / Pullback Zone: The recent rally from the swing low is a counter-trend retracement moving directly back toward the underside of the broken ascending trendline and the upper boundary of the falling channel. Candle Behavior at Resistance: The latest session closed as a narrow-range candle with upper and lower wicks right at 55,844.00, struggling just below the horizontal green resistance line at 55,943.00. This indicates seller absorption and hesitation as the index approaches supply.
Ascending Micro-Channel: The low-to-high move from the base has followed a steep micro-ascending channel (dashed yellow support line). Any decisive break below this rising slope signals the resumption of the broader breakdown impulse.
Actionable Scenarios
Bearish Continuation (Primary Trend):
Trigger: Failure to clear 55,943 – 56,095, followed by a daily close below 55,547.00.
Targets: 55,277.00, followed by a retest of the recent swing lows around the lower channel boundary.
Invalidation: Sustained close above 56,270.00.
Bullish Reclaim (Trend Invalidation):Trigger: Strong daily closing candle above 56,270.00, which would confirm a "bear trap / false breakdown" back inside the macro wedge.
Targets: Upper descending trendline resistance toward the top of the wedge structure.
Like Share follow......
Giao dịch đang hoạt động
perfectly panned out the planĐóng lệnh: đạt mục tiêu
What a trade panned out.. level to level.56600 sud see some resistance

Bài đăng liên quan
Thông báo miễn trừ trách nhiệm
Thông tin và các ấn phẩm này không nhằm mục đích, và không cấu thành, lời khuyên hoặc khuyến nghị về tài chính, đầu tư, giao dịch hay các loại khác do TradingView cung cấp hoặc xác nhận. Đọc thêm tại Điều khoản Sử dụng.
Bài đăng liên quan
Thông báo miễn trừ trách nhiệm
Thông tin và các ấn phẩm này không nhằm mục đích, và không cấu thành, lời khuyên hoặc khuyến nghị về tài chính, đầu tư, giao dịch hay các loại khác do TradingView cung cấp hoặc xác nhận. Đọc thêm tại Điều khoản Sử dụng.