
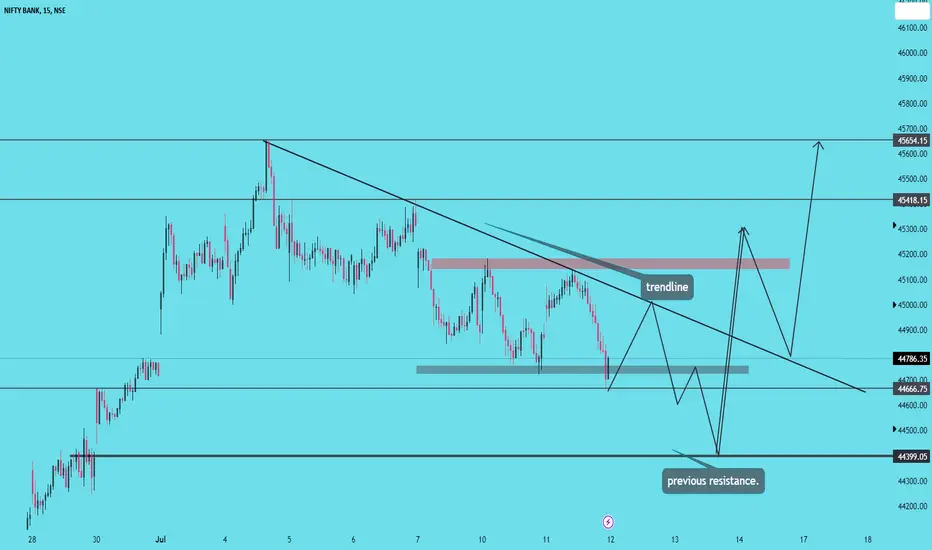
observations::
price again proven that a sign of bearishness....
Price broken our POI for sell,moving slowly to the upside...
broken the trendline..in smaller time frame and fall back...no oppurtunity to enter long...
today we have a major trendline if this trendline again acts as resistance...it will again fall back..
the big red candle is pushing the price little up...
An decending triangle is formed....which is also a sign of bullishness from the previous resistance level...
without knowing we cannot take entry on buy side...
will wait for trendline break and retest....to go long from resistance acts as support.
Ghi chú
key levels to watch...if tomorrow price again breaks 45000 level...on retest from above supply will go for buying up to bearish gap.Ghi chú
Ghi chú
Ghi chú
don't enter long..without confirmation....it will test the resistance...that red candle is rejecting...Ghi chú
gap may acts as resistance...Ghi chú
until don't go for short...price has to break the trendline...and retest...
Ghi chú
price created a channel...wait for breakout or breakdown....Ghi chú
price is at our POI for sell....Ghi chú
Ghi chú
if they want to eliminate all sellers...price will test 45000 zone again.Ghi chú
going long is tough....after break of trendline and retest..Ghi chú
Don't worry those who missed today...will get an opportunity tomorrow.Ghi chú
Exit few quantity....Giao dịch được đóng thủ công

Bài đăng liên quan
Thông báo miễn trừ trách nhiệm
Thông tin và các ấn phẩm này không nhằm mục đích, và không cấu thành, lời khuyên hoặc khuyến nghị về tài chính, đầu tư, giao dịch hay các loại khác do TradingView cung cấp hoặc xác nhận. Đọc thêm tại Điều khoản Sử dụng.
Bài đăng liên quan
Thông báo miễn trừ trách nhiệm
Thông tin và các ấn phẩm này không nhằm mục đích, và không cấu thành, lời khuyên hoặc khuyến nghị về tài chính, đầu tư, giao dịch hay các loại khác do TradingView cung cấp hoặc xác nhận. Đọc thêm tại Điều khoản Sử dụng.