
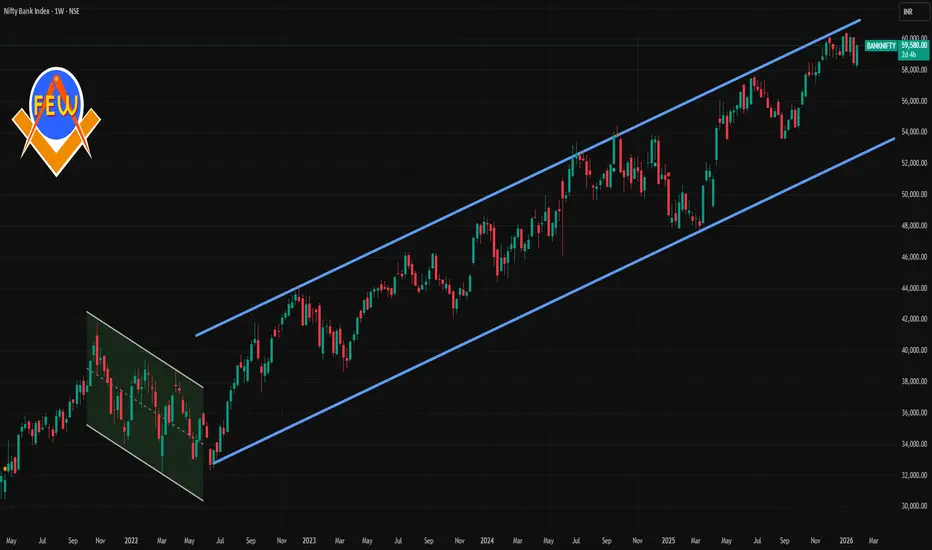
📊 Current Approx Level
Bank Nifty (NSEBANK): ~59,595 on 28 Jan 2026.
📈 Weekly Resistance Levels
1. Near-term resistance: ~₹59,600–59,700
– This zone has acted as a supply/resistance band on weekly charts.
2. Immediate overhead resistances: ~₹59,800–60,000
– Breaking and closing above this would signal stronger weekly bullish momentum.
3. Higher resistance cluster: ~₹60,000+
– Psychological/all‑time high areas — strong supply if price approaches.
📉 Weekly Support Levels
1. Key support band: ~₹58,300–58,100
– A critical weekly support zone aligned with trendlines/EMA zones.
2. Secondary support: ~₹57,000–57,500
– Important weekly structure support on pullbacks.
3. Deeper support zone: ~₹56,000 – major structure support
– Very strong demand area if broader correction deepens.
📌 Weekly Pivot Zones (Technical Reference)
From pivot analysis (classic/Fibonacci levels):
Support (S1): ~₹57,124–57,970 (depending on method)
Pivot middle: ~₹58,953
Resistance (R1−R3): ~₹59,627 – 60,780+
These can be used as reference points within the broader weekly structure.
🧠 Summary – Weekly Context
Bullish above: ~₹59,800–60,000 — breakout signals strength.
Neutral/consolidation range: ~₹57,500–59,600 — sideways trend.
Bearish below key support: <₹58,100 — risk of deeper pullback.

Contact Knowledgehub for a detailed consultation: Dm on WhatsApp: [wa.link/a2o0kz]-
Phone No: [+91 93102 26243]-
Email: [tradingviewknowledgehub@gmail.com]---
-- Let’s achieve success together!
Phone No: [+91 93102 26243]-
Email: [tradingviewknowledgehub@gmail.com]---
-- Let’s achieve success together!
Bài đăng liên quan
Thông báo miễn trừ trách nhiệm
Thông tin và các ấn phẩm này không nhằm mục đích, và không cấu thành, lời khuyên hoặc khuyến nghị về tài chính, đầu tư, giao dịch hay các loại khác do TradingView cung cấp hoặc xác nhận. Đọc thêm tại Điều khoản Sử dụng.