
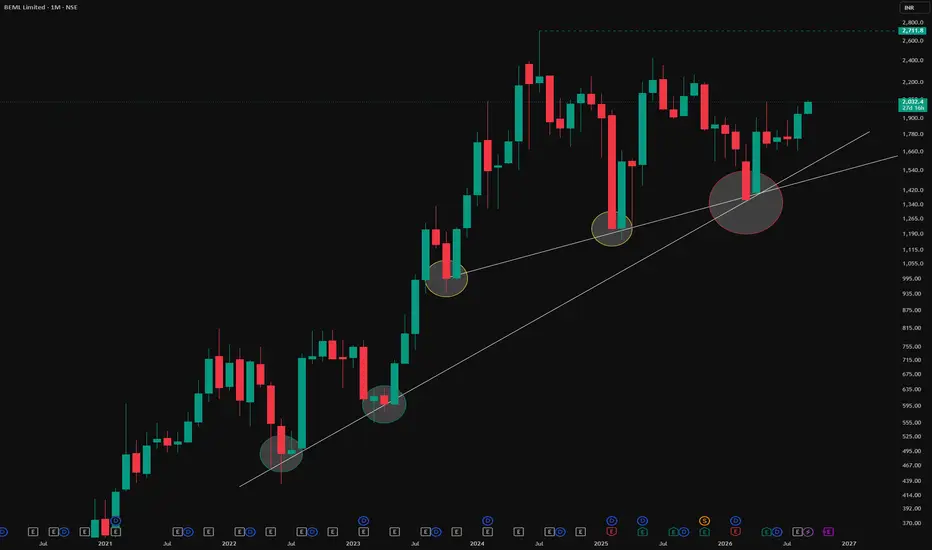
This post is educational and observational in nature based on historical price action on the monthly timeframe. It is not a forecast or a trading recommendation.Using older than 3 months charts
The Two Trendlines
Two separate trendlines have been drawn on the monthly timeframe. The smaller green circles mark the touchpoints of the first trendline, while the smaller yellow circles mark the touchpoints of the second, each line independently respected by price across its own set of touches.
The Confluence Point
The larger red circle marks the exact intersection of these two trendlines. A few months back, price reacted right at this intersection, an area where two independently drawn trendlines happened to meet. When separate technical references align at the same location, this is referred to as trendline confluence, and price respecting that exact point adds meaningful weight to the observation.
The Two Trendlines
Two separate trendlines have been drawn on the monthly timeframe. The smaller green circles mark the touchpoints of the first trendline, while the smaller yellow circles mark the touchpoints of the second, each line independently respected by price across its own set of touches.
The Confluence Point
The larger red circle marks the exact intersection of these two trendlines. A few months back, price reacted right at this intersection, an area where two independently drawn trendlines happened to meet. When separate technical references align at the same location, this is referred to as trendline confluence, and price respecting that exact point adds meaningful weight to the observation.

📊Swing & positional research with Buy, Sell & Hold recommendations
Contact for NOVEMBER SLOTS
📞WhatsApp: wa.me/919455664601
📢Free Picks on Telegram : t.me/hashtaghammer
Apoorv Dubey|SEBI RA INH000030287
Contact for NOVEMBER SLOTS
📞WhatsApp: wa.me/919455664601
📢Free Picks on Telegram : t.me/hashtaghammer
Apoorv Dubey|SEBI RA INH000030287
Bài đăng liên quan
Thông báo miễn trừ trách nhiệm
Thông tin và các ấn phẩm này không nhằm mục đích, và không cấu thành, lời khuyên hoặc khuyến nghị về tài chính, đầu tư, giao dịch hay các loại khác do TradingView cung cấp hoặc xác nhận. Đọc thêm tại Điều khoản Sử dụng.
📊Swing & positional research with Buy, Sell & Hold recommendations
Contact for NOVEMBER SLOTS
📞WhatsApp: wa.me/919455664601
📢Free Picks on Telegram : t.me/hashtaghammer
Apoorv Dubey|SEBI RA INH000030287
Contact for NOVEMBER SLOTS
📞WhatsApp: wa.me/919455664601
📢Free Picks on Telegram : t.me/hashtaghammer
Apoorv Dubey|SEBI RA INH000030287
Bài đăng liên quan
Thông báo miễn trừ trách nhiệm
Thông tin và các ấn phẩm này không nhằm mục đích, và không cấu thành, lời khuyên hoặc khuyến nghị về tài chính, đầu tư, giao dịch hay các loại khác do TradingView cung cấp hoặc xác nhận. Đọc thêm tại Điều khoản Sử dụng.