
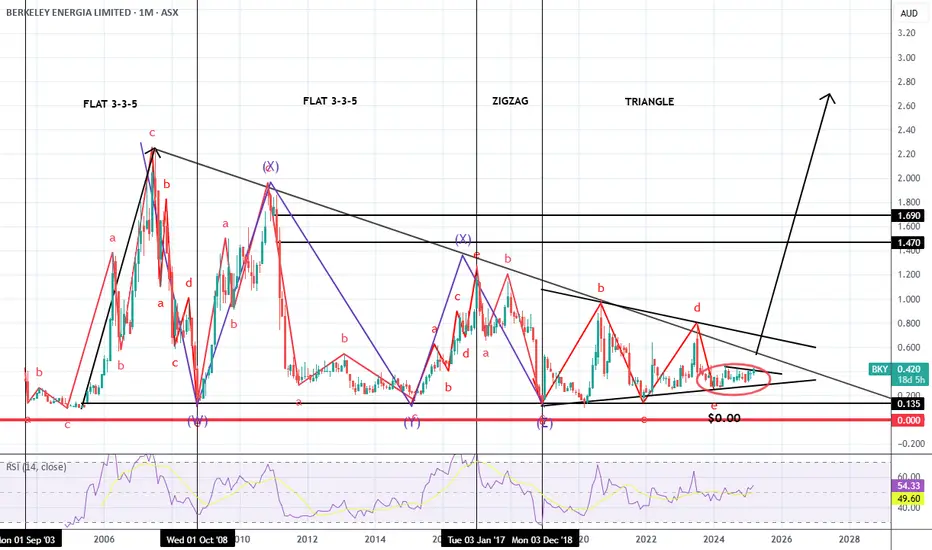
BKY Monthly chart
Elliot wave corrective patterns and Large triangle, added Triangle base target estimate to possible breakout area
Likely $2.70, currently $0.425 = 630% or 6.3 reward to risk if you are willing to keep it to $0.00
Not making money but very experienced and qualified management team developing its spanish mine,
BKY has a current ratio of 31x which suggests it has large reserves circa ~$75mil as of Early 2025 suggesting it has a large reserve to convert assets into production
Elliot wave corrective patterns and Large triangle, added Triangle base target estimate to possible breakout area
Likely $2.70, currently $0.425 = 630% or 6.3 reward to risk if you are willing to keep it to $0.00
Not making money but very experienced and qualified management team developing its spanish mine,
BKY has a current ratio of 31x which suggests it has large reserves circa ~$75mil as of Early 2025 suggesting it has a large reserve to convert assets into production
Ghi chú
As an alternative theory, There is a potential for this to be a small triangle for a further move down to $0.13This would represent a triangle throwover and if there are buying signs on lower timeframes would offer a lower risk opportunity to buy
Timing is not critical for me as this is a multi year trade but interesting structure to see as 20year triangles are not very common
Giao dịch đang hoạt động
Breakout to upside, already at $0.545 and likely to continue climbing, likely the start of a large move given the consolidation below and relatively tight price actionWould not be surprised to large upward moves ahead, but I never buy on large bars

Thông báo miễn trừ trách nhiệm
Thông tin và các ấn phẩm này không nhằm mục đích, và không cấu thành, lời khuyên hoặc khuyến nghị về tài chính, đầu tư, giao dịch hay các loại khác do TradingView cung cấp hoặc xác nhận. Đọc thêm tại Điều khoản Sử dụng.
Thông báo miễn trừ trách nhiệm
Thông tin và các ấn phẩm này không nhằm mục đích, và không cấu thành, lời khuyên hoặc khuyến nghị về tài chính, đầu tư, giao dịch hay các loại khác do TradingView cung cấp hoặc xác nhận. Đọc thêm tại Điều khoản Sử dụng.