
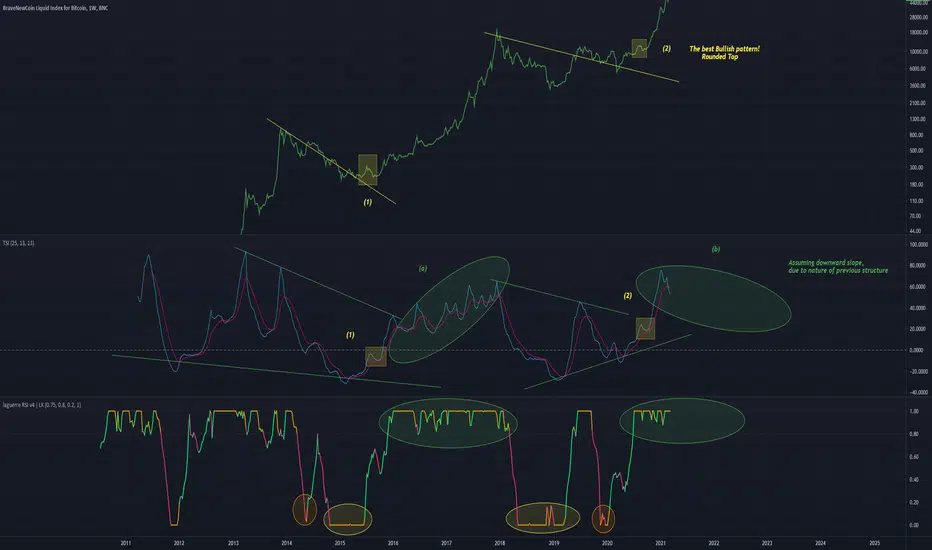
An idea using more indicators than usual
Patterns within TSI can be identified, assume that the 2017 parabola repeats (green circle on TSI)
Rounded top can be seen to produce consistent results throughout the history of BTC
My gut tells me that another 2017 parabolic wont occur again, and the different in structures on these indicators will account for that
I still believe Ethereum has a lot more potential for long term returns than BTC, and ill keep believing that until it eventuates.

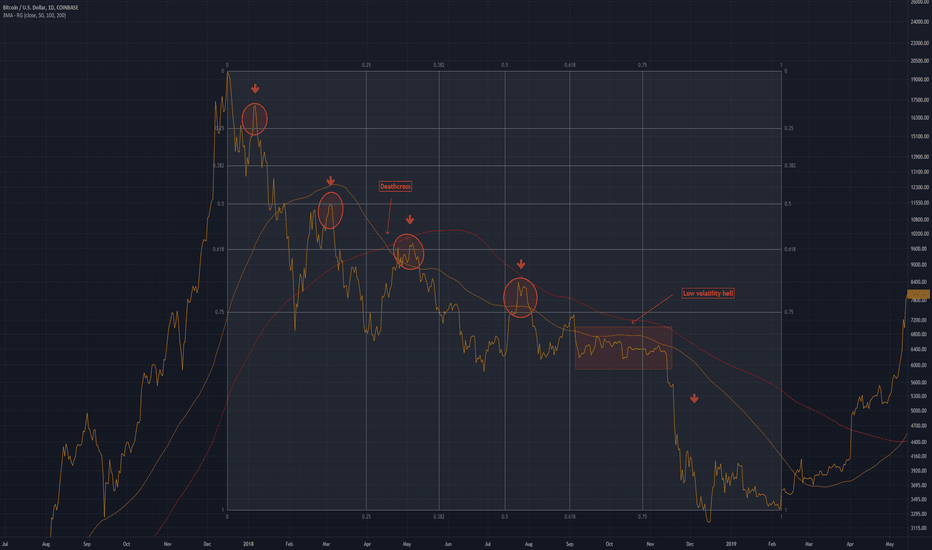
Above is an analysis of the 2018 Bear Market for BTC
Patterns within TSI can be identified, assume that the 2017 parabola repeats (green circle on TSI)
Rounded top can be seen to produce consistent results throughout the history of BTC
My gut tells me that another 2017 parabolic wont occur again, and the different in structures on these indicators will account for that
I still believe Ethereum has a lot more potential for long term returns than BTC, and ill keep believing that until it eventuates.
Above is an analysis of the 2018 Bear Market for BTC

Thông báo miễn trừ trách nhiệm
Thông tin và các ấn phẩm này không nhằm mục đích, và không cấu thành, lời khuyên hoặc khuyến nghị về tài chính, đầu tư, giao dịch hay các loại khác do TradingView cung cấp hoặc xác nhận. Đọc thêm tại Điều khoản Sử dụng.
Thông báo miễn trừ trách nhiệm
Thông tin và các ấn phẩm này không nhằm mục đích, và không cấu thành, lời khuyên hoặc khuyến nghị về tài chính, đầu tư, giao dịch hay các loại khác do TradingView cung cấp hoặc xác nhận. Đọc thêm tại Điều khoản Sử dụng.