
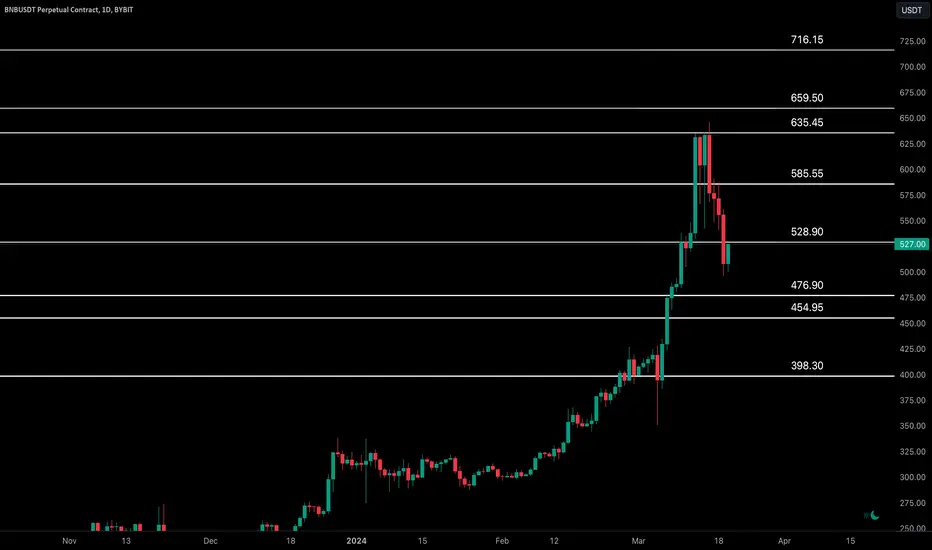
Binancecoin declined from the key resistance zone of $635-$660.
A sustained price action below $529 will push #BNB price lower to $455-$477.
A daily candle closure above the key daily resistance zone of $635-$660 is required for another bullish extension towards $716, the new ATH.
Intraday Chart

The BNBUSDT intraday chart is in the bearish territory below $548.
A re-test of the resistance zone of $463-$487 and a bullish rejection will lead to a bullish rally to $548.
A solid bullish break-out of $548 will push price higher towards $600.
A bearish break-out of $463-$487 will lead to a dip towards $407-$433 and, possibly lower.
A sustained price action below $529 will push #BNB price lower to $455-$477.
A daily candle closure above the key daily resistance zone of $635-$660 is required for another bullish extension towards $716, the new ATH.
Intraday Chart
The BNBUSDT intraday chart is in the bearish territory below $548.
A re-test of the resistance zone of $463-$487 and a bullish rejection will lead to a bullish rally to $548.
A solid bullish break-out of $548 will push price higher towards $600.
A bearish break-out of $463-$487 will lead to a dip towards $407-$433 and, possibly lower.

Check out the daily market updates on youtube.com/@TradeLeanCom
Bài đăng liên quan
Thông báo miễn trừ trách nhiệm
Thông tin và các ấn phẩm này không nhằm mục đích, và không cấu thành, lời khuyên hoặc khuyến nghị về tài chính, đầu tư, giao dịch hay các loại khác do TradingView cung cấp hoặc xác nhận. Đọc thêm tại Điều khoản Sử dụng.