
📊 BNB/USDT Market Structure Shift 🔄 | Bearish Channel ➝ Bullish Recovery 🚀
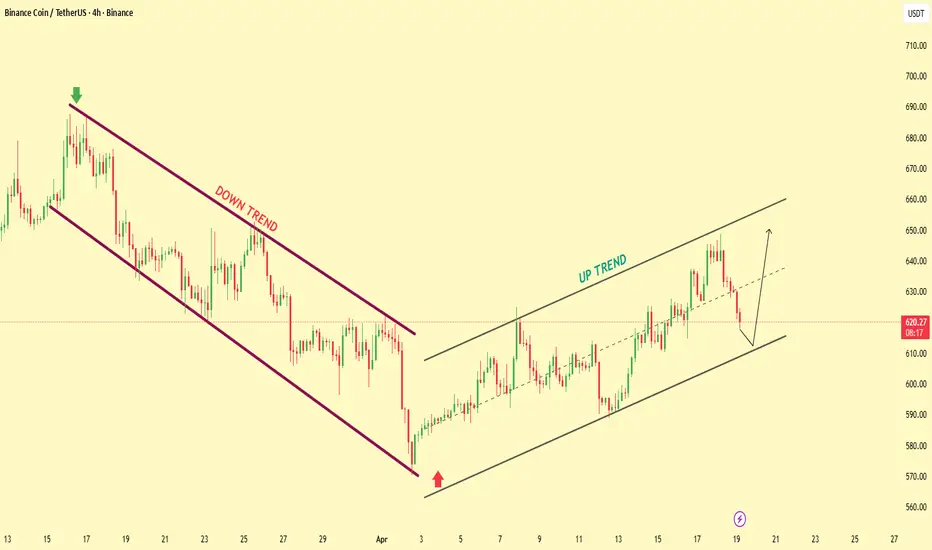
This chart clearly shows a transition phase from a strong downtrend to a developing uptrend channel, highlighting a potential continuation setup.
🔻 Phase 1: Bearish Channel (Distribution Zone)
Price respected a well-defined descending channel with multiple touches.
Consistent lower highs & lower lows confirm strong seller control.
The breakdown near the end shows capitulation / sell-off momentum.
🔄 Phase 2: Reversal & Accumulation
Sharp rejection from the bottom (around 570 zone) indicates strong demand entry.
Formation of a base suggests accumulation before trend shift.
Market structure begins to break previous lower highs.
🔺 Phase 3: Bullish Channel Formation (Uptrend)
Price enters a clean ascending channel with higher highs & higher lows.
Trendline support is respected → confirms buyer dominance.
Internal dotted trendline shows short-term momentum structure.
⚠️ Current Situation (Key Zone)
Price is pulling back from upper resistance of the channel (~640–650).
Currently approaching mid/lower channel support (~610–615).
🎯 Trading Outlook
✅ Bullish Scenario:
If price holds support → continuation toward 650+ zone likely.
❌ Bearish Scenario:
Break below channel support → possible drop toward 600–590.
💡 Conclusion
The market has shifted from bearish control to bullish structure, but current pullback is critical. Watch support reaction carefully — this is a decision zone.
This chart clearly shows a transition phase from a strong downtrend to a developing uptrend channel, highlighting a potential continuation setup.
🔻 Phase 1: Bearish Channel (Distribution Zone)
Price respected a well-defined descending channel with multiple touches.
Consistent lower highs & lower lows confirm strong seller control.
The breakdown near the end shows capitulation / sell-off momentum.
🔄 Phase 2: Reversal & Accumulation
Sharp rejection from the bottom (around 570 zone) indicates strong demand entry.
Formation of a base suggests accumulation before trend shift.
Market structure begins to break previous lower highs.
🔺 Phase 3: Bullish Channel Formation (Uptrend)
Price enters a clean ascending channel with higher highs & higher lows.
Trendline support is respected → confirms buyer dominance.
Internal dotted trendline shows short-term momentum structure.
⚠️ Current Situation (Key Zone)
Price is pulling back from upper resistance of the channel (~640–650).
Currently approaching mid/lower channel support (~610–615).
🎯 Trading Outlook
✅ Bullish Scenario:
If price holds support → continuation toward 650+ zone likely.
❌ Bearish Scenario:
Break below channel support → possible drop toward 600–590.
💡 Conclusion
The market has shifted from bearish control to bullish structure, but current pullback is critical. Watch support reaction carefully — this is a decision zone.
Giao dịch đang hoạt động
**🚀 Trade Result – Target Achieved**
Price reversed cleanly from the downtrend, respected the new bullish channel, and delivered the move exactly as planned.
✅ Structure shift confirmed
✅ Trend followed
🎯 Target hit
Clean setup, clean execution.

✦ MARKET STRATEGY SIGNALS ✦ 📊
Smart Money • Price Action • Precision • good entries
📲 Join Telegram: t.me/marketstrategyentry
Smart Money • Price Action • Precision • good entries
📲 Join Telegram: t.me/marketstrategyentry
Bài đăng liên quan
Thông báo miễn trừ trách nhiệm
Thông tin và các ấn phẩm này không nhằm mục đích, và không cấu thành, lời khuyên hoặc khuyến nghị về tài chính, đầu tư, giao dịch hay các loại khác do TradingView cung cấp hoặc xác nhận. Đọc thêm tại Điều khoản Sử dụng.
✦ MARKET STRATEGY SIGNALS ✦ 📊
Smart Money • Price Action • Precision • good entries
📲 Join Telegram: t.me/marketstrategyentry
Smart Money • Price Action • Precision • good entries
📲 Join Telegram: t.me/marketstrategyentry
Bài đăng liên quan
Thông báo miễn trừ trách nhiệm
Thông tin và các ấn phẩm này không nhằm mục đích, và không cấu thành, lời khuyên hoặc khuyến nghị về tài chính, đầu tư, giao dịch hay các loại khác do TradingView cung cấp hoặc xác nhận. Đọc thêm tại Điều khoản Sử dụng.