
Please leave a LIKE in order to support my work.
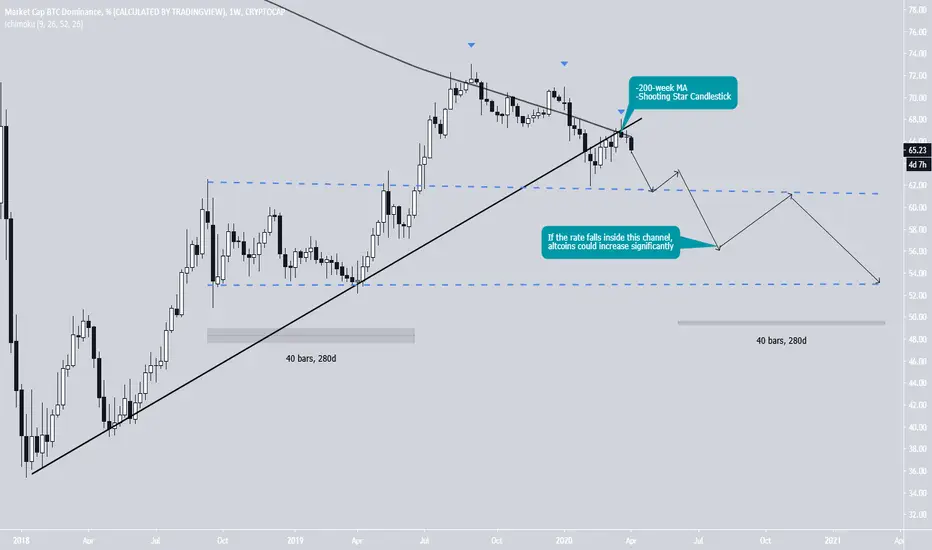
The weekly chart reveals that the price has broken down from a long-term ascending support line and validated it as resistance afterwards. This view is also strengthened by the fact that the rate was rejected by the 200-week MA thrice prior to the price breaking down. The final time, it created a shooting star weekly candlestick, which often indicates a trend reversal. So far, it has created three consecutive lower highs.
The most important support level is at 62.5%, which mark the wick low of Feb 10-17. If the rate decreases below it, it could fall all the way to 52.5%, levels not seen since April 2019.
Previously, the rate traded inside this range from September 2018 to April 2019, a period which was very profitable for altcoins. If the price falls within this range once more, it is possible that it would have a similar effect.
The weekly chart reveals that the price has broken down from a long-term ascending support line and validated it as resistance afterwards. This view is also strengthened by the fact that the rate was rejected by the 200-week MA thrice prior to the price breaking down. The final time, it created a shooting star weekly candlestick, which often indicates a trend reversal. So far, it has created three consecutive lower highs.
The most important support level is at 62.5%, which mark the wick low of Feb 10-17. If the rate decreases below it, it could fall all the way to 52.5%, levels not seen since April 2019.
Previously, the rate traded inside this range from September 2018 to April 2019, a period which was very profitable for altcoins. If the price falls within this range once more, it is possible that it would have a similar effect.

Thông báo miễn trừ trách nhiệm
Thông tin và các ấn phẩm này không nhằm mục đích, và không cấu thành, lời khuyên hoặc khuyến nghị về tài chính, đầu tư, giao dịch hay các loại khác do TradingView cung cấp hoặc xác nhận. Đọc thêm tại Điều khoản Sử dụng.
Thông báo miễn trừ trách nhiệm
Thông tin và các ấn phẩm này không nhằm mục đích, và không cấu thành, lời khuyên hoặc khuyến nghị về tài chính, đầu tư, giao dịch hay các loại khác do TradingView cung cấp hoặc xác nhận. Đọc thêm tại Điều khoản Sử dụng.