
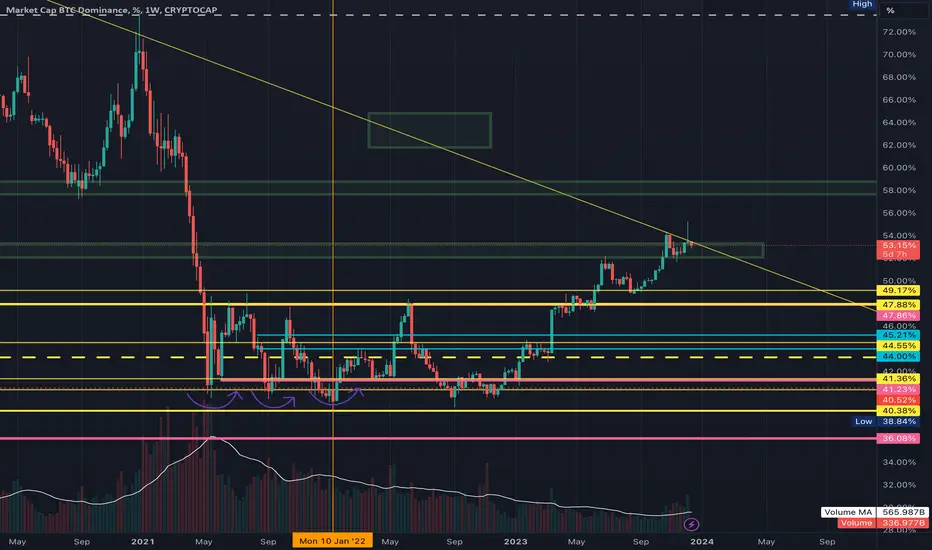
despite that long ter pas from my latest analysis about Dominance , all the lines and analysis have been done over 1.5 years ago at the time that crash happened , I followed the money follow at that time on the price chart and find the probable demand and supply areas on dominance which worked well till now , and as you can see the reactions on each line was accurate , but this area that we are facing now is very important , breaking the yellow diagonal line could lead dominance over 55 and it can reach to 58 % which is very important factor in crypto market , this could cause a huge crash on Altcoins (on /btc pairs) and could cause a unrecoverable damage to their value against BTC.
and the vise versa exactly can be considered , the fall of dominance from this stage could give the alts a huge pump (considering the money that flowed into crypto market lately almost half a Trillion $) that caused this pumb.
so we need to be alert about each situation . this idea need to be update by some other related charts (Total and Total2 along ETH.D ).
and the vise versa exactly can be considered , the fall of dominance from this stage could give the alts a huge pump (considering the money that flowed into crypto market lately almost half a Trillion $) that caused this pumb.
so we need to be alert about each situation . this idea need to be update by some other related charts (Total and Total2 along ETH.D ).
Ghi chú
its worth to see the situation in different time frames , helps us to understand how would be the possible future .
Thông báo miễn trừ trách nhiệm
Thông tin và các ấn phẩm này không nhằm mục đích, và không cấu thành, lời khuyên hoặc khuyến nghị về tài chính, đầu tư, giao dịch hay các loại khác do TradingView cung cấp hoặc xác nhận. Đọc thêm tại Điều khoản Sử dụng.
Thông báo miễn trừ trách nhiệm
Thông tin và các ấn phẩm này không nhằm mục đích, và không cấu thành, lời khuyên hoặc khuyến nghị về tài chính, đầu tư, giao dịch hay các loại khác do TradingView cung cấp hoặc xác nhận. Đọc thêm tại Điều khoản Sử dụng.