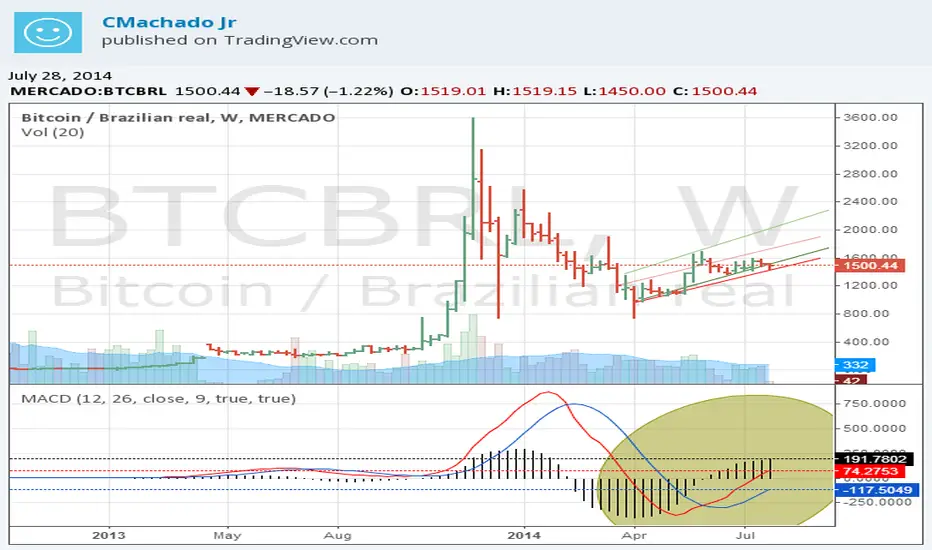
A linha do histograma macd= linha macd - linha sinal apresenta tendencia de alta, a linhas de suporte de baixa e de alta , em vermelho representando os momentos de baixa e as verdes representando os momentos de alta , mostram uma leve discrepancia, um angulo diferencial, das 2 linha verde, um que acusam um tendencia de alta.
The online macd histogram macd = line - trend line signal is high, the support lines of low and high, red representing low moments and green representing the moments of high, show a slight discrepancy, a differential angle ,red lines and green line , who suffers from a tendency to high.
The online macd histogram macd = line - trend line signal is high, the support lines of low and high, red representing low moments and green representing the moments of high, show a slight discrepancy, a differential angle ,red lines and green line , who suffers from a tendency to high.

Thông báo miễn trừ trách nhiệm
Thông tin và các ấn phẩm này không nhằm mục đích, và không cấu thành, lời khuyên hoặc khuyến nghị về tài chính, đầu tư, giao dịch hay các loại khác do TradingView cung cấp hoặc xác nhận. Đọc thêm tại Điều khoản Sử dụng.
Thông báo miễn trừ trách nhiệm
Thông tin và các ấn phẩm này không nhằm mục đích, và không cấu thành, lời khuyên hoặc khuyến nghị về tài chính, đầu tư, giao dịch hay các loại khác do TradingView cung cấp hoặc xác nhận. Đọc thêm tại Điều khoản Sử dụng.