
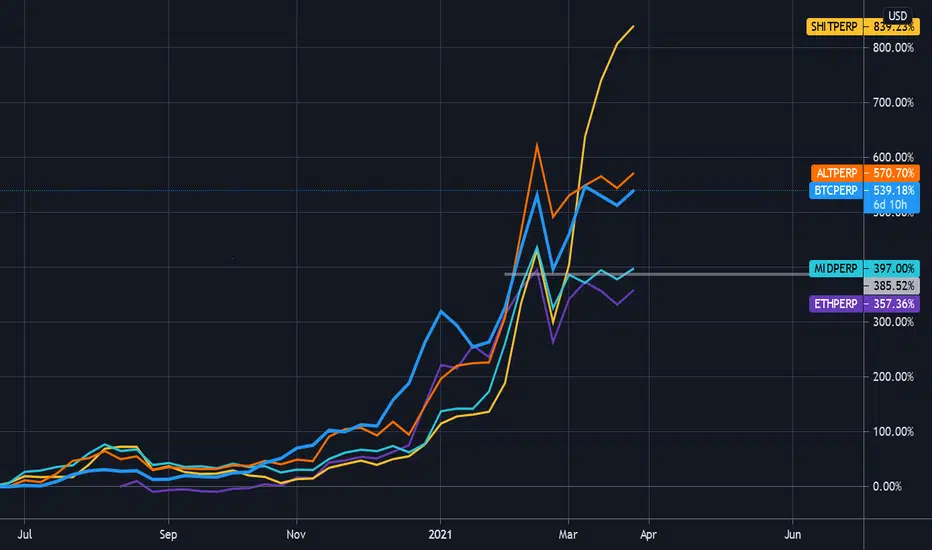
The idea behind this chart is to give a snapshot of the market breadth for the entire crypto market at a glance. It uses the perpetual index futures on the FTX exchange to compare Bitcoin to Ethereum, the ALT index, the Midcap index,and the SHIT index.
This particular chart is using a Weekly interval and uses the March 2020 lows as it's anchor point (adjust scale if necessary). It's clear to see that while Bitcoin has been grabbing most of the headlines, the SHITCOIN index is in the driver's seat (help.ftx.com/hc/en-us/articles/360027668812-Index-Calculation).
This particular chart is using a Weekly interval and uses the March 2020 lows as it's anchor point (adjust scale if necessary). It's clear to see that while Bitcoin has been grabbing most of the headlines, the SHITCOIN index is in the driver's seat (help.ftx.com/hc/en-us/articles/360027668812-Index-Calculation).

Thông báo miễn trừ trách nhiệm
Thông tin và các ấn phẩm này không nhằm mục đích, và không cấu thành, lời khuyên hoặc khuyến nghị về tài chính, đầu tư, giao dịch hay các loại khác do TradingView cung cấp hoặc xác nhận. Đọc thêm tại Điều khoản Sử dụng.
Thông báo miễn trừ trách nhiệm
Thông tin và các ấn phẩm này không nhằm mục đích, và không cấu thành, lời khuyên hoặc khuyến nghị về tài chính, đầu tư, giao dịch hay các loại khác do TradingView cung cấp hoặc xác nhận. Đọc thêm tại Điều khoản Sử dụng.