
I want to caveat this post with the fact that I've never read any Gann books and only privy to the bare minimum knowledge in how to use Gann tools.
First off, I don't really subscribe to the "mystical" aspects of Gann's work, but to me that doesn't invalidate the other aspects of his work. In fact most Gann tools are just visual depictions of market sentiments. After all, isn't that what technical analysis mostly is? A visual/quantitative study of human behavior and reaction? Gann angles = sentiment. Gann boxes/intervals = patience/time.
And so we use Gann tools not like some mystical pentagram chart to wealth, but simply as a ruler to quantify and measure sentiment and patience.
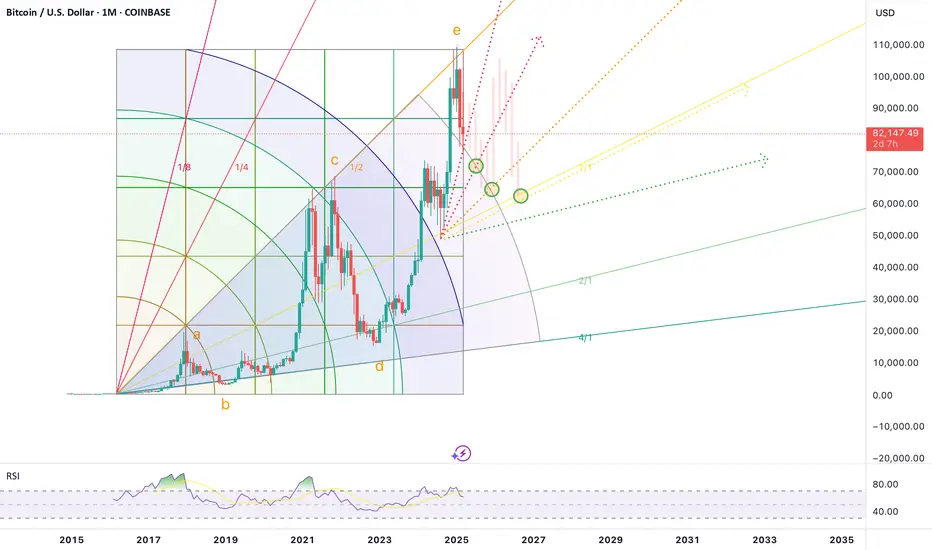
For reference sakes I'm going to label the current Bitcoin chart as an a-b-c-d-e expanding diagonal wave I (maybe it is, maybe it isn't... not relevant for this chart). An observation I made was that wave e seems to be similar in characteristics to a wave d but played in reverse... so why not model the upcoming wave as a flipped version of wave c (adjusted for time)?
Using Gann angles from the most recent local bottom (dashed lines) we see a bounce off the 1/8 angle. 1/8 to me represents euphoria so IMO a continuation upwards cannot be ruled out here... however given the broad market's aversion to risk right now, an intermediate term corrective wave seems more likely. So we model a flipped wave c to prepare for entry points.
TLDR; bullish long term, neutral to bearish short term
First off, I don't really subscribe to the "mystical" aspects of Gann's work, but to me that doesn't invalidate the other aspects of his work. In fact most Gann tools are just visual depictions of market sentiments. After all, isn't that what technical analysis mostly is? A visual/quantitative study of human behavior and reaction? Gann angles = sentiment. Gann boxes/intervals = patience/time.
And so we use Gann tools not like some mystical pentagram chart to wealth, but simply as a ruler to quantify and measure sentiment and patience.
For reference sakes I'm going to label the current Bitcoin chart as an a-b-c-d-e expanding diagonal wave I (maybe it is, maybe it isn't... not relevant for this chart). An observation I made was that wave e seems to be similar in characteristics to a wave d but played in reverse... so why not model the upcoming wave as a flipped version of wave c (adjusted for time)?
Using Gann angles from the most recent local bottom (dashed lines) we see a bounce off the 1/8 angle. 1/8 to me represents euphoria so IMO a continuation upwards cannot be ruled out here... however given the broad market's aversion to risk right now, an intermediate term corrective wave seems more likely. So we model a flipped wave c to prepare for entry points.
TLDR; bullish long term, neutral to bearish short term
Giao dịch đang hoạt động
A year and half ago I posted this and we have now hit the latter 2 hypothesized inflection points. Bitcoin is poised to turn bullish soon. Long and strong into the next halving. Đóng lệnh: đạt mục tiêu
Original hypo was that each correction successfully tests progressively steeper Gann angles. 2018 tested the 4/1, 4 4 years later a successful test of the 2/1. Now another 4 years later we are testing the 1/1. Target is the 1/2. Not financial advice, choose your own adventure.

Thông báo miễn trừ trách nhiệm
Thông tin và các ấn phẩm này không nhằm mục đích, và không cấu thành, lời khuyên hoặc khuyến nghị về tài chính, đầu tư, giao dịch hay các loại khác do TradingView cung cấp hoặc xác nhận. Đọc thêm tại Điều khoản Sử dụng.
Thông báo miễn trừ trách nhiệm
Thông tin và các ấn phẩm này không nhằm mục đích, và không cấu thành, lời khuyên hoặc khuyến nghị về tài chính, đầu tư, giao dịch hay các loại khác do TradingView cung cấp hoặc xác nhận. Đọc thêm tại Điều khoản Sử dụng.