
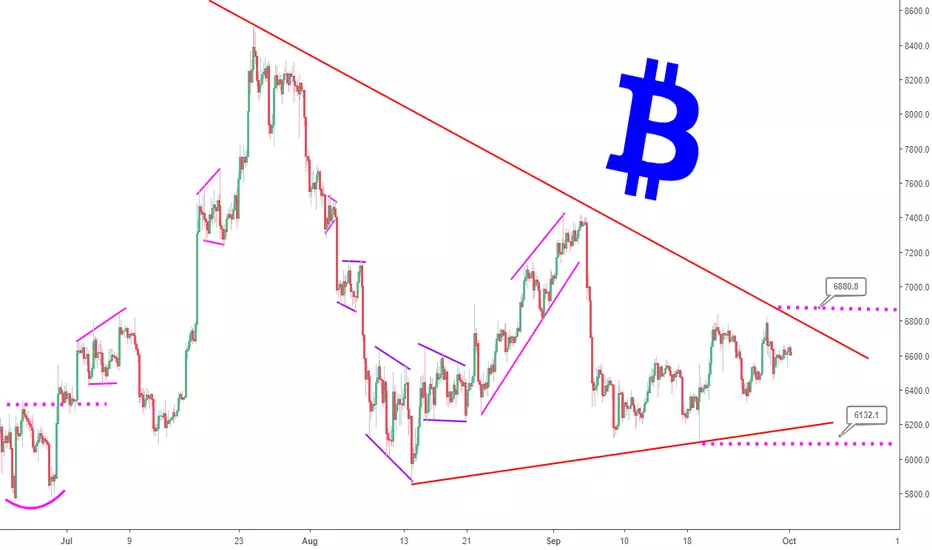
The 4 hour timeframe of Bitcoin is displayed in this analysis with price action from June 24, 2018 to current date. The overall sideways price action is captured with a symmetrical triangle chart pattern.
The implication of the chart pattern above is a balance between supply and demand for Bitcoin. ~$6,880.80 and $6,132.10 mark price levels that indicate possible exits from the chart pattern with the former indicating resumption of bullish momentum, and the latter bearish.
Width of the triangle is highly valuable in projection of price after a successful exit from the triangle.
The implication of the chart pattern above is a balance between supply and demand for Bitcoin. ~$6,880.80 and $6,132.10 mark price levels that indicate possible exits from the chart pattern with the former indicating resumption of bullish momentum, and the latter bearish.
Width of the triangle is highly valuable in projection of price after a successful exit from the triangle.

Bài đăng liên quan
Thông báo miễn trừ trách nhiệm
Thông tin và các ấn phẩm này không nhằm mục đích, và không cấu thành, lời khuyên hoặc khuyến nghị về tài chính, đầu tư, giao dịch hay các loại khác do TradingView cung cấp hoặc xác nhận. Đọc thêm tại Điều khoản Sử dụng.
Bài đăng liên quan
Thông báo miễn trừ trách nhiệm
Thông tin và các ấn phẩm này không nhằm mục đích, và không cấu thành, lời khuyên hoặc khuyến nghị về tài chính, đầu tư, giao dịch hay các loại khác do TradingView cung cấp hoặc xác nhận. Đọc thêm tại Điều khoản Sử dụng.