
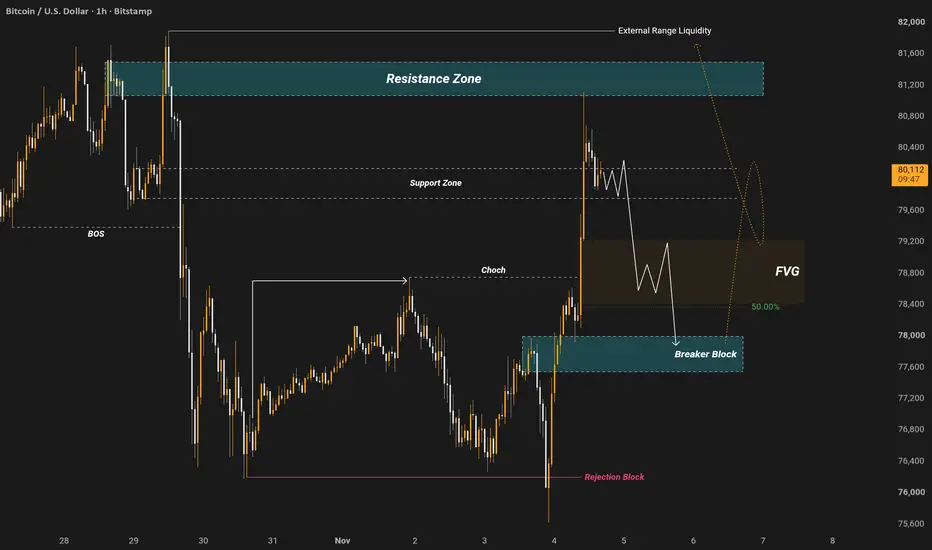
Welcome traders to this comprehensive institutional grade market analysis of Bitcoin on the 1 hour timeframe. In this detailed breakdown we will examine the current price action dynamics, short term sell retracements, fair value gaps, breaker blocks, and the 50 percent Fibonacci equilibrium target shown on the chart. The primary objective of this analysis is to provide a complete and professional roadmap of how institutional order flow is dictating the short term downward retracement while keeping long term external liquidity in perspective, all without any unnecessary complexity.
Understanding Short Term Retracement and Market Bias:
The chart highlights a short term sell setup where the market is currently experiencing a corrective retracement. In institutional trading, when price undergoes a rapid impulsive expansion, it often pulls back into a discount or equilibrium zone to rebalance the order book before continuing its broader trajectory. This analysis focuses on capturing this short term bearish retracement leg down towards the equilibrium level, allowing traders to align with the immediate corrective momentum while managing risk effectively.
Resistance Zone and External Range Liquidity Context:
At the upper boundary of the chart, a major Resistance Zone is clearly marked alongside External Range Liquidity. External range liquidity refers to significant swing highs where resting stop losses and pending breakout orders accumulate. When price sweeps or approaches these outer boundaries, institutional participants use that liquidity to execute large orders. The long term projection points towards these upper external pools, but for the immediate trade setup, price has rejected this resistance area and initiated a downward move.
Change of Character and Structural Shifts:
The chart features levels marked as Choch which stands for Change of Character. A Change of Character occurs when market structure transitions from a bullish bias to a bearish bias, signaling a shift in short term order flow. On the 1 hour timeframe, this structural break indicates that buyers are losing momentum and sellers are stepping in to take control, paving the way for the anticipated short retracement phase.
Breaker Block and Support Zone Mechanics:
Further down the structure, specific areas are designated as a Breaker Block and a Support Zone. A breaker block is a failed order block that has flipped its role in the market, acting as a powerful area of interest where price can find temporary support or resistance. As price expands downward during this retracement, these structural levels serve as important milestones where market participants monitor reactions.
Fair Value Gap and 50 Percent Equilibrium Target:
The core of this short setup centers around the Fair Value Gap marked on the chart, aligning precisely with the 50 percent Fibonacci equilibrium level. Equilibrium represents the exact midpoint of a dealing range where supply and balance are temporarily equal. The projected path on the chart illustrates price dropping from the upper resistance into this Fair Value Gap and equilibrium zone, making it the primary target for the short position. Reaching this 50 percent level allows traders to capture the logical retracement before the market decides on its next major macro expansion.
Trade Execution and Risk Management Framework:
To trade this short retracement setup effectively, patience and strict adherence to risk management are required. Short entries are typically considered following rejections from upper resistance or continuation breakdowns, with stop losses placed safely above the structural swing highs. Partial profits can be locked in near the Fair Value Gap and equilibrium target, satisfying the short term objective while keeping long term targets in mind for future expansions.
Disclaimer:
This analysis is strictly for educational and informational purposes only and does not constitute financial or investment advice. Always manage your risk responsibly and conduct your own thorough analysis before executing any trades in the financial markets.
Understanding Short Term Retracement and Market Bias:
The chart highlights a short term sell setup where the market is currently experiencing a corrective retracement. In institutional trading, when price undergoes a rapid impulsive expansion, it often pulls back into a discount or equilibrium zone to rebalance the order book before continuing its broader trajectory. This analysis focuses on capturing this short term bearish retracement leg down towards the equilibrium level, allowing traders to align with the immediate corrective momentum while managing risk effectively.
Resistance Zone and External Range Liquidity Context:
At the upper boundary of the chart, a major Resistance Zone is clearly marked alongside External Range Liquidity. External range liquidity refers to significant swing highs where resting stop losses and pending breakout orders accumulate. When price sweeps or approaches these outer boundaries, institutional participants use that liquidity to execute large orders. The long term projection points towards these upper external pools, but for the immediate trade setup, price has rejected this resistance area and initiated a downward move.
Change of Character and Structural Shifts:
The chart features levels marked as Choch which stands for Change of Character. A Change of Character occurs when market structure transitions from a bullish bias to a bearish bias, signaling a shift in short term order flow. On the 1 hour timeframe, this structural break indicates that buyers are losing momentum and sellers are stepping in to take control, paving the way for the anticipated short retracement phase.
Breaker Block and Support Zone Mechanics:
Further down the structure, specific areas are designated as a Breaker Block and a Support Zone. A breaker block is a failed order block that has flipped its role in the market, acting as a powerful area of interest where price can find temporary support or resistance. As price expands downward during this retracement, these structural levels serve as important milestones where market participants monitor reactions.
Fair Value Gap and 50 Percent Equilibrium Target:
The core of this short setup centers around the Fair Value Gap marked on the chart, aligning precisely with the 50 percent Fibonacci equilibrium level. Equilibrium represents the exact midpoint of a dealing range where supply and balance are temporarily equal. The projected path on the chart illustrates price dropping from the upper resistance into this Fair Value Gap and equilibrium zone, making it the primary target for the short position. Reaching this 50 percent level allows traders to capture the logical retracement before the market decides on its next major macro expansion.
Trade Execution and Risk Management Framework:
To trade this short retracement setup effectively, patience and strict adherence to risk management are required. Short entries are typically considered following rejections from upper resistance or continuation breakdowns, with stop losses placed safely above the structural swing highs. Partial profits can be locked in near the Fair Value Gap and equilibrium target, satisfying the short term objective while keeping long term targets in mind for future expansions.
Disclaimer:
This analysis is strictly for educational and informational purposes only and does not constitute financial or investment advice. Always manage your risk responsibly and conduct your own thorough analysis before executing any trades in the financial markets.
Giao dịch đang hoạt động
Going so smooth 
Join My Free Telegram Signal
t.me/+K6J2uweHFzxiNDFk
Follow The Trend Not a Crowd
t.me/+K6J2uweHFzxiNDFk
Follow The Trend Not a Crowd
Thông báo miễn trừ trách nhiệm
Thông tin và các ấn phẩm này không nhằm mục đích, và không cấu thành, lời khuyên hoặc khuyến nghị về tài chính, đầu tư, giao dịch hay các loại khác do TradingView cung cấp hoặc xác nhận. Đọc thêm tại Điều khoản Sử dụng.
Join My Free Telegram Signal
t.me/+K6J2uweHFzxiNDFk
Follow The Trend Not a Crowd
t.me/+K6J2uweHFzxiNDFk
Follow The Trend Not a Crowd
Thông báo miễn trừ trách nhiệm
Thông tin và các ấn phẩm này không nhằm mục đích, và không cấu thành, lời khuyên hoặc khuyến nghị về tài chính, đầu tư, giao dịch hay các loại khác do TradingView cung cấp hoặc xác nhận. Đọc thêm tại Điều khoản Sử dụng.