
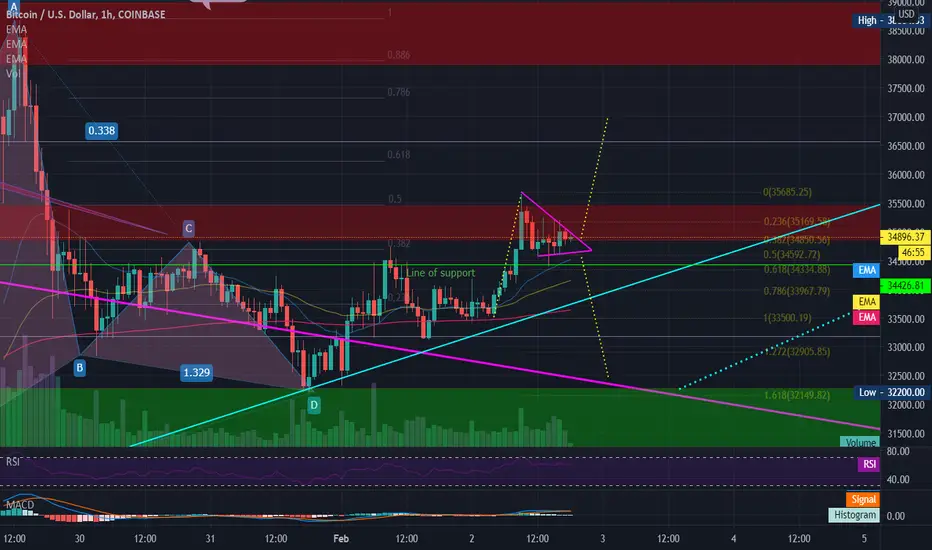
Looking at the 1hr chart it looks like Bitcoin has been rounding up it's pups and is ready to make a break for it.
The measured move up would give us a target above the red resistance box. I'll be looking for a back test to flip it to support if we get up above $35,500 again.
If we break down then I will be looking at several areas for support, the first being the .5 to .618 Fib retrace of the last move. About $32,200 would be my target for the downside and I'd be looking for a hard bounce from there.
Here is the daily chart. Is that an inverted head and shoulders?

If you twist my whiskers I'll admit my bullish bias.
The trend is our friend until it ends!
Owhooooo!
The measured move up would give us a target above the red resistance box. I'll be looking for a back test to flip it to support if we get up above $35,500 again.
If we break down then I will be looking at several areas for support, the first being the .5 to .618 Fib retrace of the last move. About $32,200 would be my target for the downside and I'd be looking for a hard bounce from there.
Here is the daily chart. Is that an inverted head and shoulders?
If you twist my whiskers I'll admit my bullish bias.
The trend is our friend until it ends!
Owhooooo!
Ghi chú
RAOWFF! Ghi chú
A back test on the 4hr (or 1hr) or a continuation of the measured move?Ghi chú
The very rare Sleeping Dragon...we all know what happens when it awakens! Owhooooo!
Ghi chú
Ghi chú
The dragon is awake! $37,900 I think is the next stop!
Thông báo miễn trừ trách nhiệm
Thông tin và các ấn phẩm này không nhằm mục đích, và không cấu thành, lời khuyên hoặc khuyến nghị về tài chính, đầu tư, giao dịch hay các loại khác do TradingView cung cấp hoặc xác nhận. Đọc thêm tại Điều khoản Sử dụng.
Thông báo miễn trừ trách nhiệm
Thông tin và các ấn phẩm này không nhằm mục đích, và không cấu thành, lời khuyên hoặc khuyến nghị về tài chính, đầu tư, giao dịch hay các loại khác do TradingView cung cấp hoặc xác nhận. Đọc thêm tại Điều khoản Sử dụng.